VSCode Extension User Guide
This guide provides comprehensive instructions for installing and using the Synaptics SRSDK VSCode Extension.
Extension Installation
Pre-requisites:
Before using the extension, ensure the latest version of vscode is installed and code command is available in your terminal:
Windows/Linux: Add the path to VS Code’s bin folder to your system’s PATH environment variable.
macOS: Open the Command Palette in VS Code, search for “Shell Command: Install ‘code’ command in PATH”, and run it.
Verify: In your terminal, run code –version to confirm it’s working.
Supported platforms:
Windows systems with x64-based architecture.
Linux systems (Ubuntu 22.04 and above) with x86_64 architecture.
Linux systems (Ubuntu 22.04 and above) with aarch64 architecture.
Mac systems with x86_64 architecture.
Mac systems with ARM64 architecture.
Steps to install the extension package
Use Astra_MCU_SDK_vscode_extension-1.1 extension VSIX file from the Release package: <parent directory>/tools/
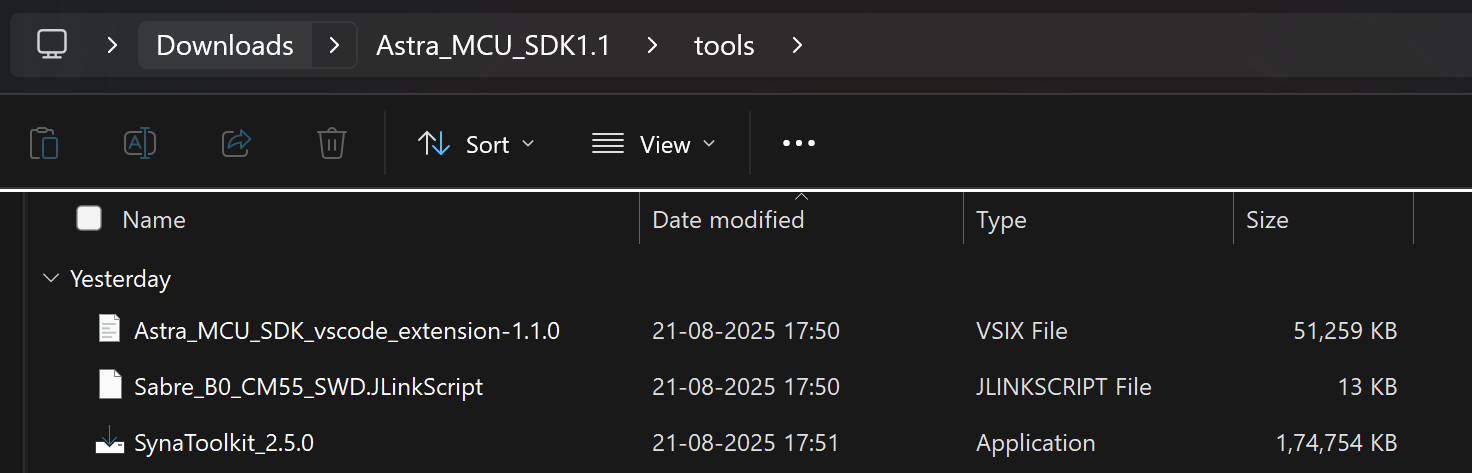
Figure Path to extension package
Install the VSIX file in VS Code terminal using the following command,
code –install-extension path/to/VSIX file
The installed extension will be displayed on the left side of VS Code extension (activity bar, where we can find the Synaptics extension).

Figure Synaptics Extension icon
After installing the extension, the homepage opens showing its details. The extension version can also be verified from this tab.
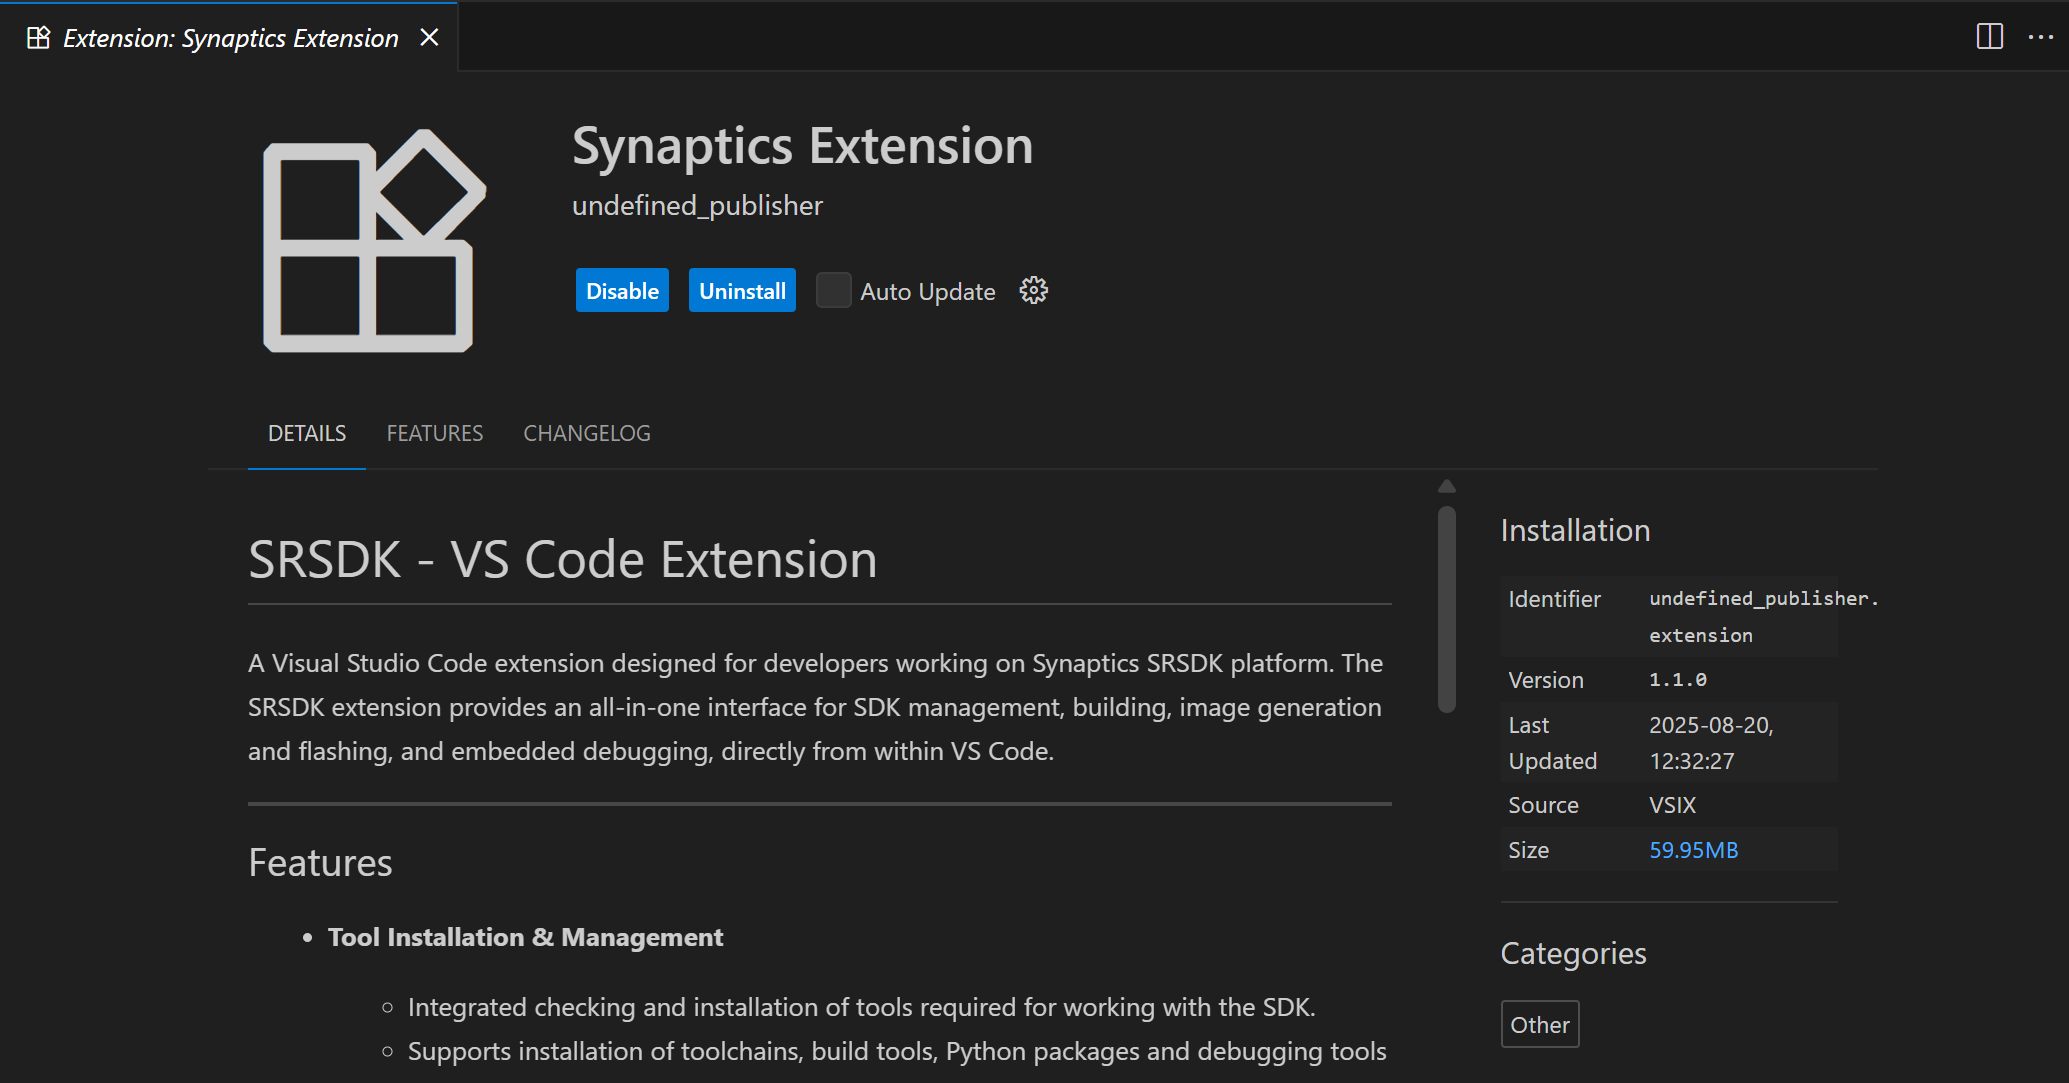
Figure Synaptics extension homepage
Steps to uninstall old package and reinstall updated one
Remove the currently imported SDK from the workspace using the “Remove from workspace” option.
Figure Remove from Workspace
Uninstall the current extension using the “Uninstall” button.

Figure Uninstall button
Close any active Webview or reload the window.
Install the new extension VSIX package by following the steps outlined in Steps to install the extension package.
Install or reinstall the required tools (as per the Release Notes if any) and then import the SDK into the workspace.
Install Tools
Purpose: To check and install the necessary tools for docker setup, image flashing and debugging.
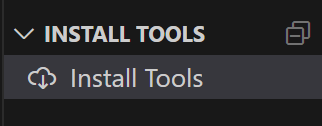
Figure Install Tools
Tools checking
Steps:
This view will check if the necessary tools are already installed in well-known installation locations.
Tools checking is performed when the tab is opened for the first time. Subsequently, users can manually check the tool status by clicking the “Check tool status” button. A progress loader will be displayed to show the percentage of tools checking progress.
Note: On Linux and macOS, jq is required to read and write the settings.json file. If it’s not installed, a terminal will open to install it, and you’ll be prompted to enter your system password. Once installed, the extension will continue checking tool status automatically.

Figure jq install terminal
Result:
If a tool is missing or its version does not match the required version, an exclamation mark (⚠️) will be displayed, and the installation checkbox will be automatically selected.
If a tool is already installed with the correct version, a green checkmark (
 ) will appear, and the installation checkbox will
remain unselected.
) will appear, and the installation checkbox will
remain unselected.
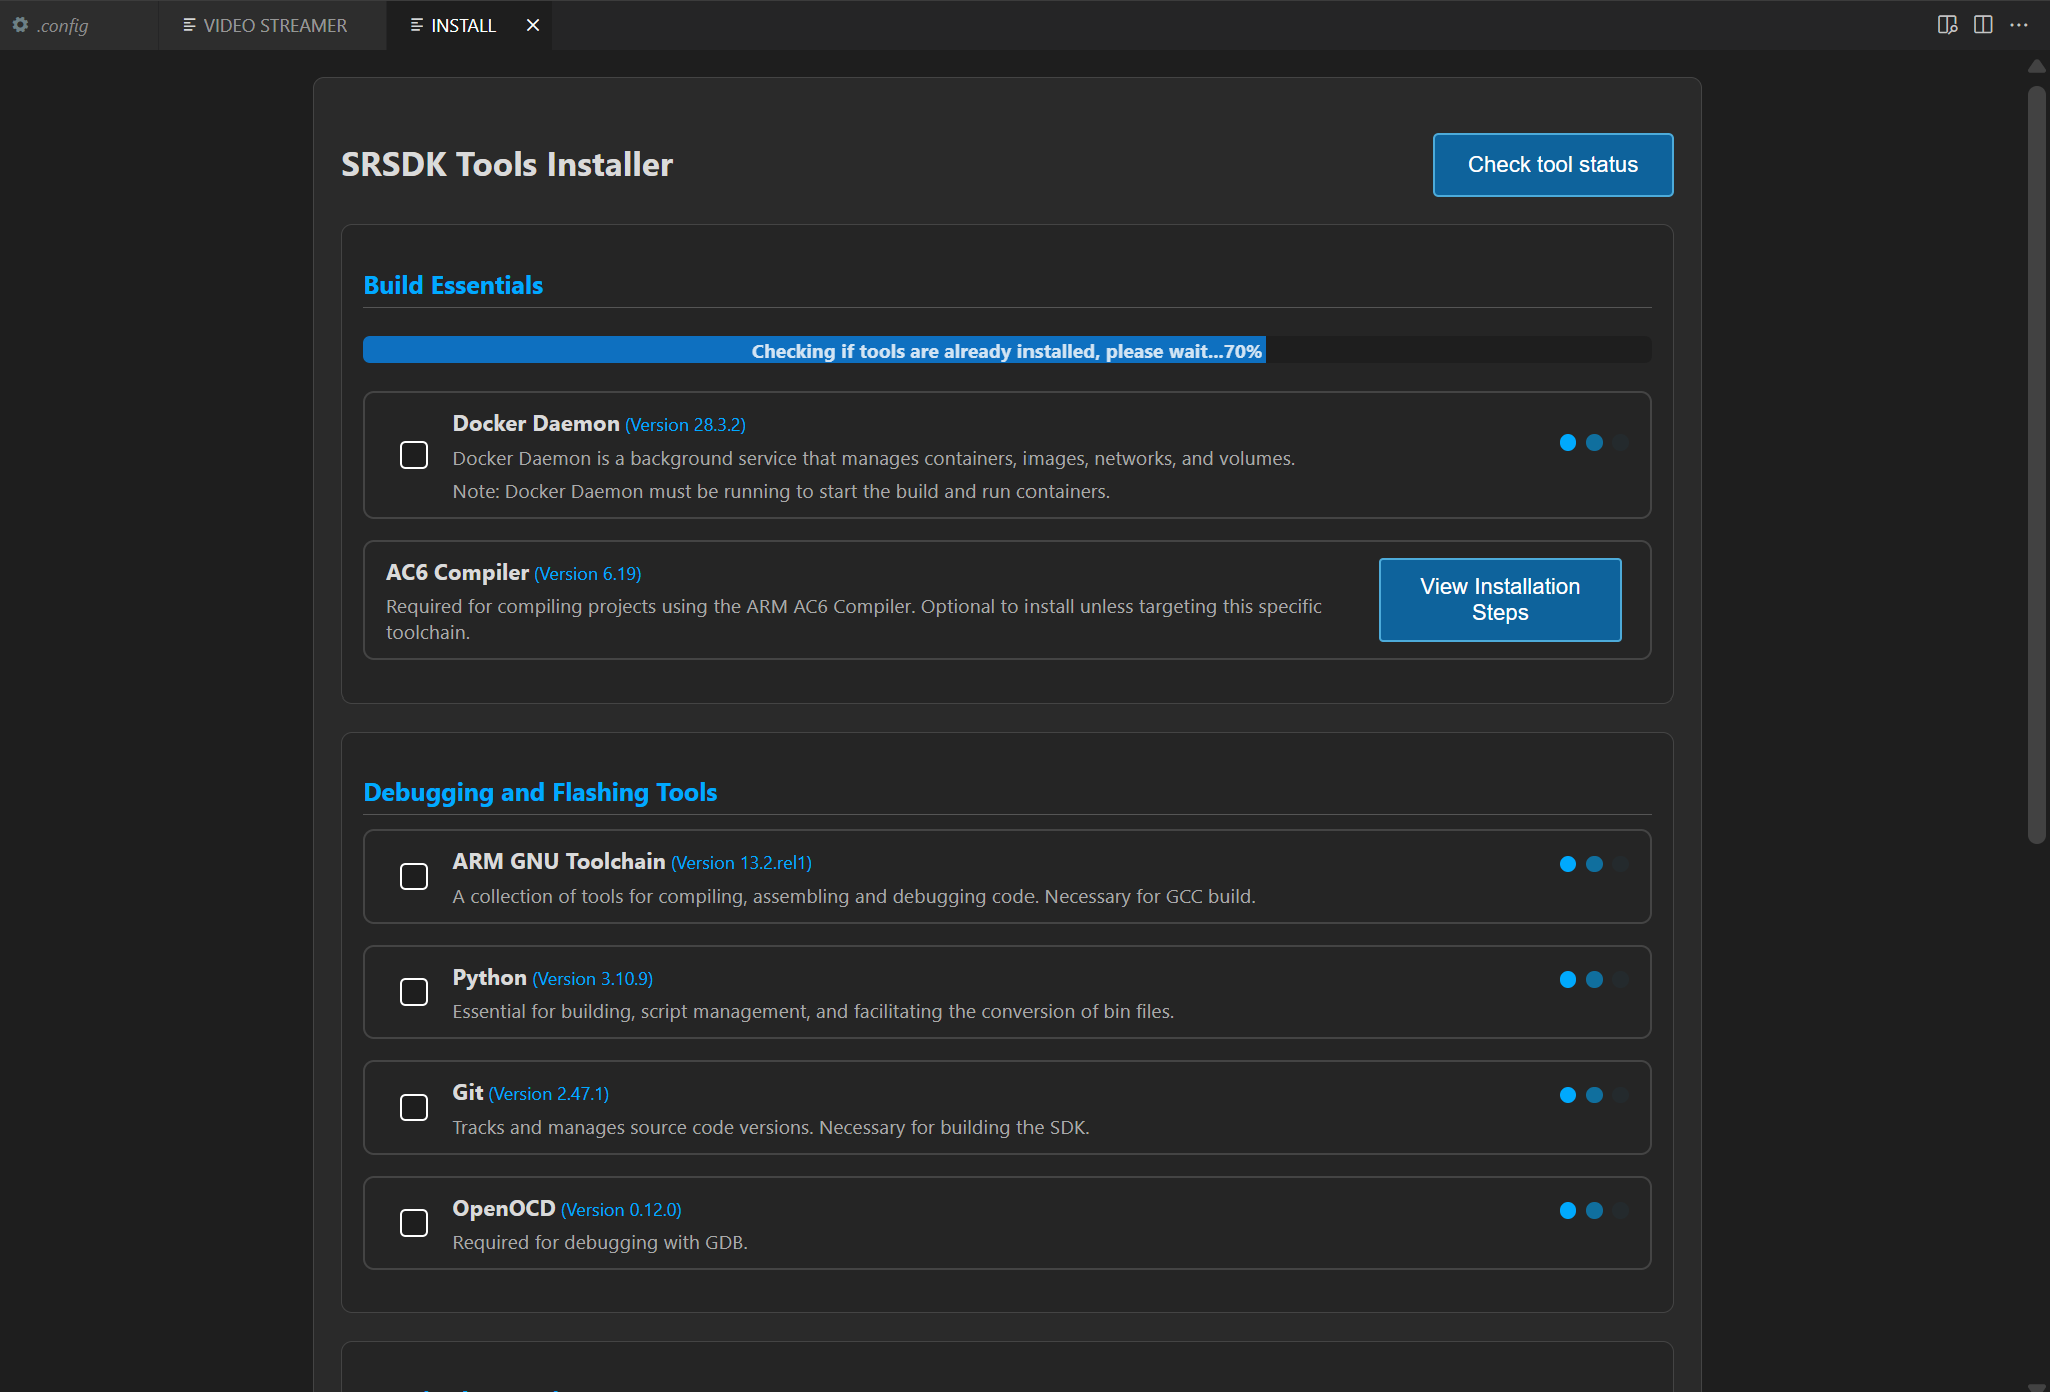
Figure Tools Checking
Tools installation
Steps:
After the tools check, you can select a directory to install the selected tools, or use the default installation path:
Windows: C:/Users/<username>/SRSDK_Build_tools
Linux/macOS: /home/<username>/SRSDK_Build_tools
Click “Install” to install the selected tools. This action will run the installation script in the “Install Script Terminal”, where you can view the logs. A loader will be displayed at the bottom to indicate the tools installation progress.
For installing AC6 compiler, click on “View Installation Steps” button and follow the steps. Refer figure for the installation steps for AC6 compiler.
Note:
The AC6 compiler is not available on macOS, so native AC6 builds are not supported. However, the extension enables AC6 builds on macOS by using the Linux archives. Detailed instructions are provided in the AC6 Compiler Installation Steps (see Figure 9).
On Linux and macOS, you’ll be prompted to enter your password in the ‘Install Script Terminal’ to proceed with the installation.
Docker Daemon installation is also included in the list of tools to be installed.
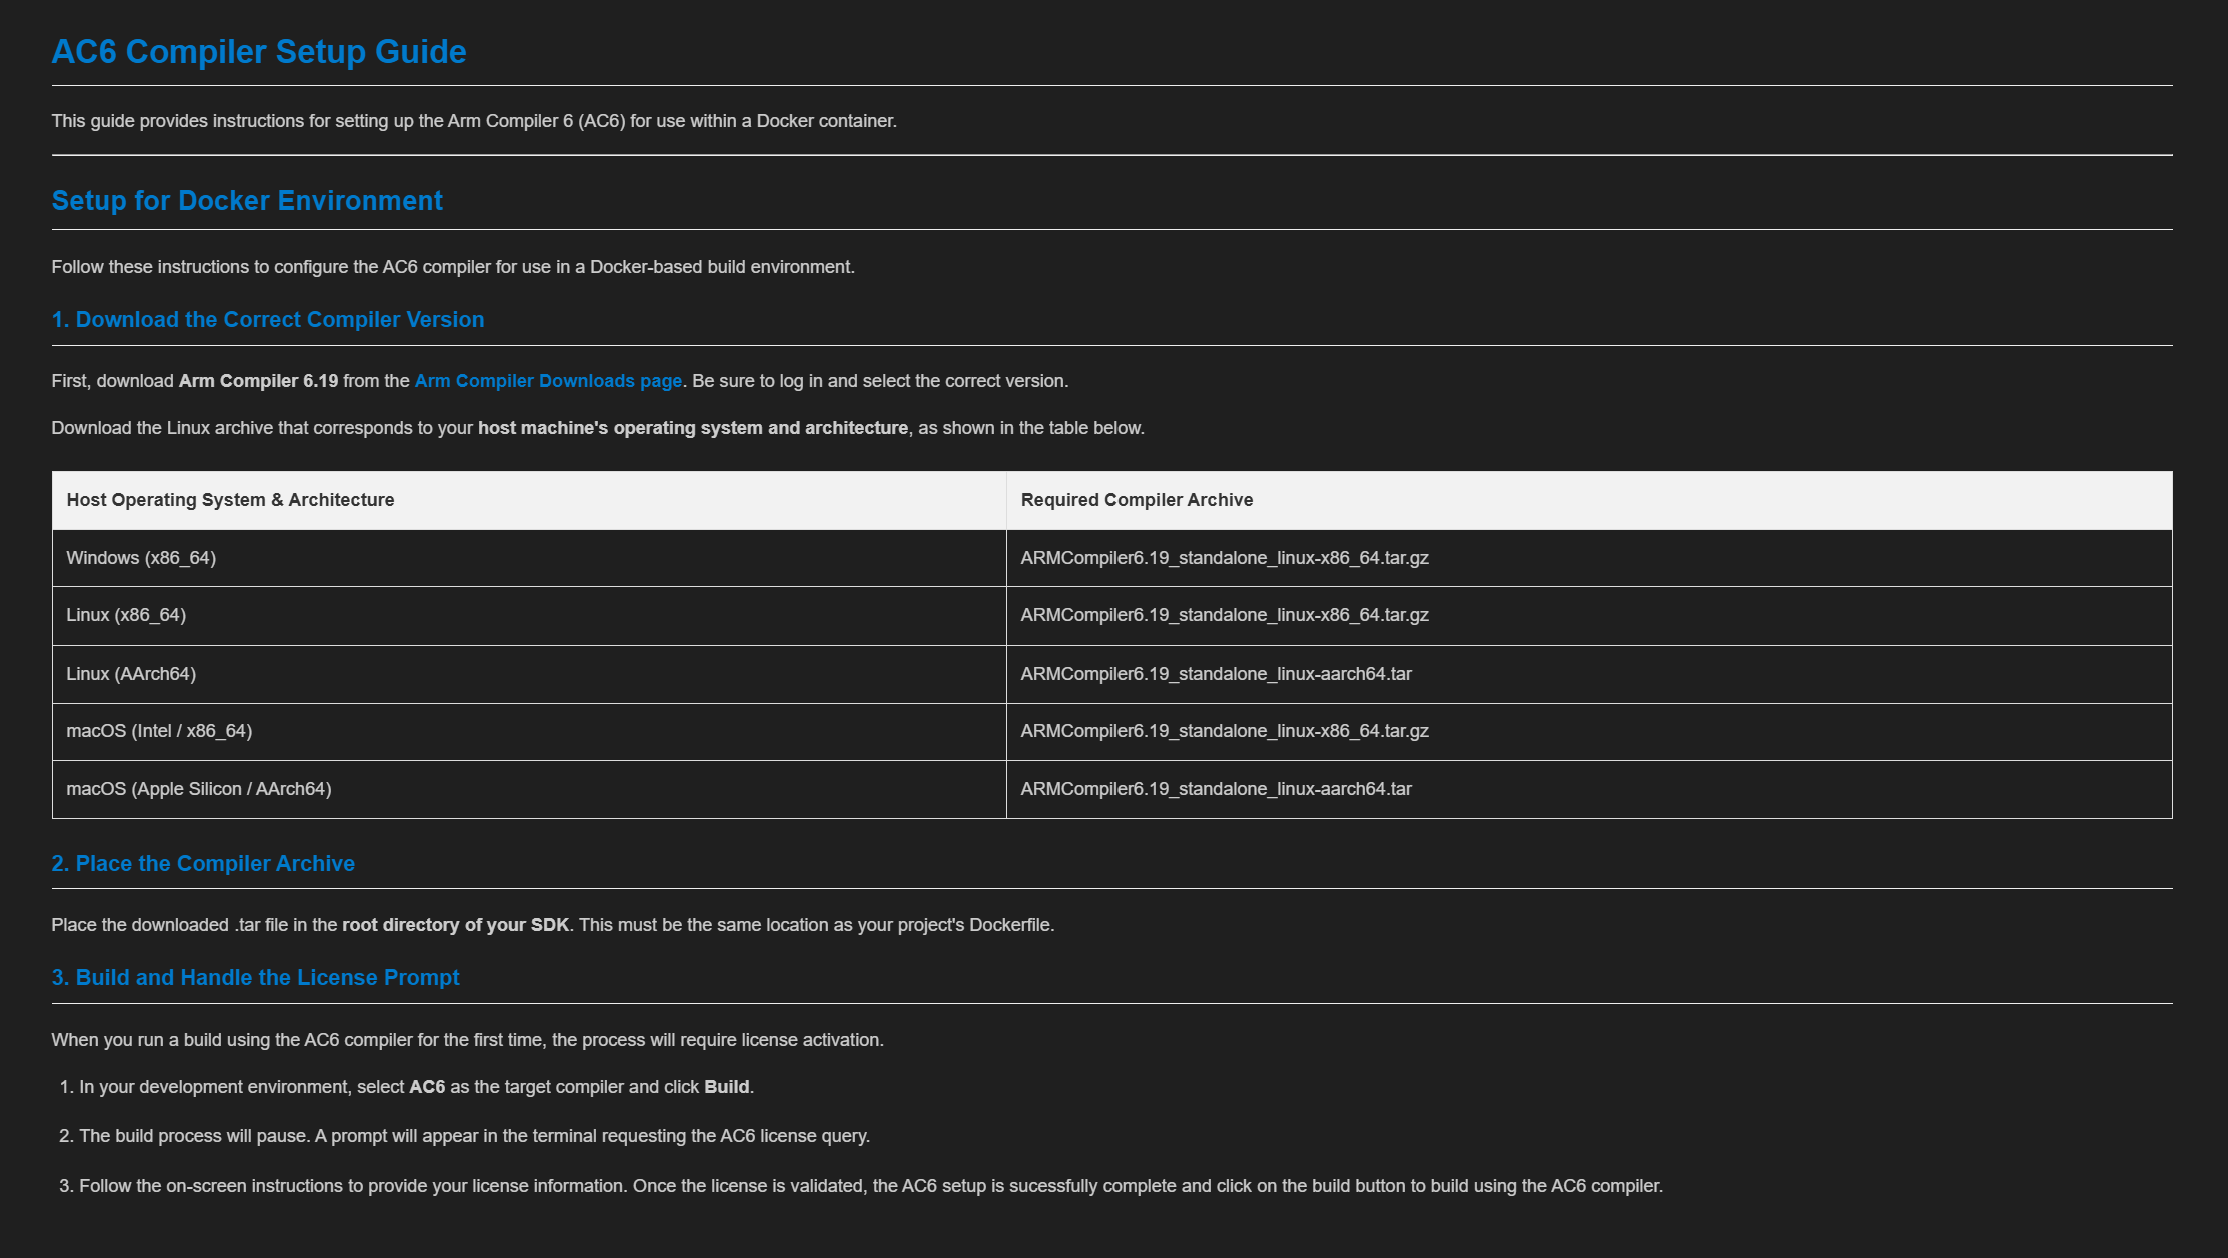
Figure Steps to install AC6 compiler
Docker Installation
The Astra SRSDK vscode Extension 1.1.0 is upgraded to use Docker for Build and image generation process. The following steps provides a comprehensive guide to install docker and start docker desktop. The tool installation feature of the Astra SRSDK vscode extension includes installation for docker.
You may install Latest version of Docker in either of the following ways:
Using the built-in tool installer provided with the Astra SRSDK vscode extension, or
Directly from the official Docker documentation: https://docs.docker.com/
Platform Requirements:
Platform |
Installation Requirement |
Notes |
|---|---|---|
Windows |
Docker Desktop (GUI) |
Shows Subscription Service Agreement on first launch. Requires elevated privileges if auto-install fails. |
macOS |
Docker Desktop (GUI) |
Same as Windows – accept terms and optionally sign in. |
Linux |
Docker Engine (CLI only) |
Runs as a background service automatically after install. |
General Notes:
After installation, ensure the Docker engine is running before building with the SDK extension.
On Windows/macOS, Docker Desktop may prompt for sign-in (optional).
On Linux, no GUI is needed; the service runs automatically.
Installation via vscode Extension
Open the Astra_MCU_SDK_vscode_extension.
- Go to the Install Tools tab → Select Docker Daemon Tool.
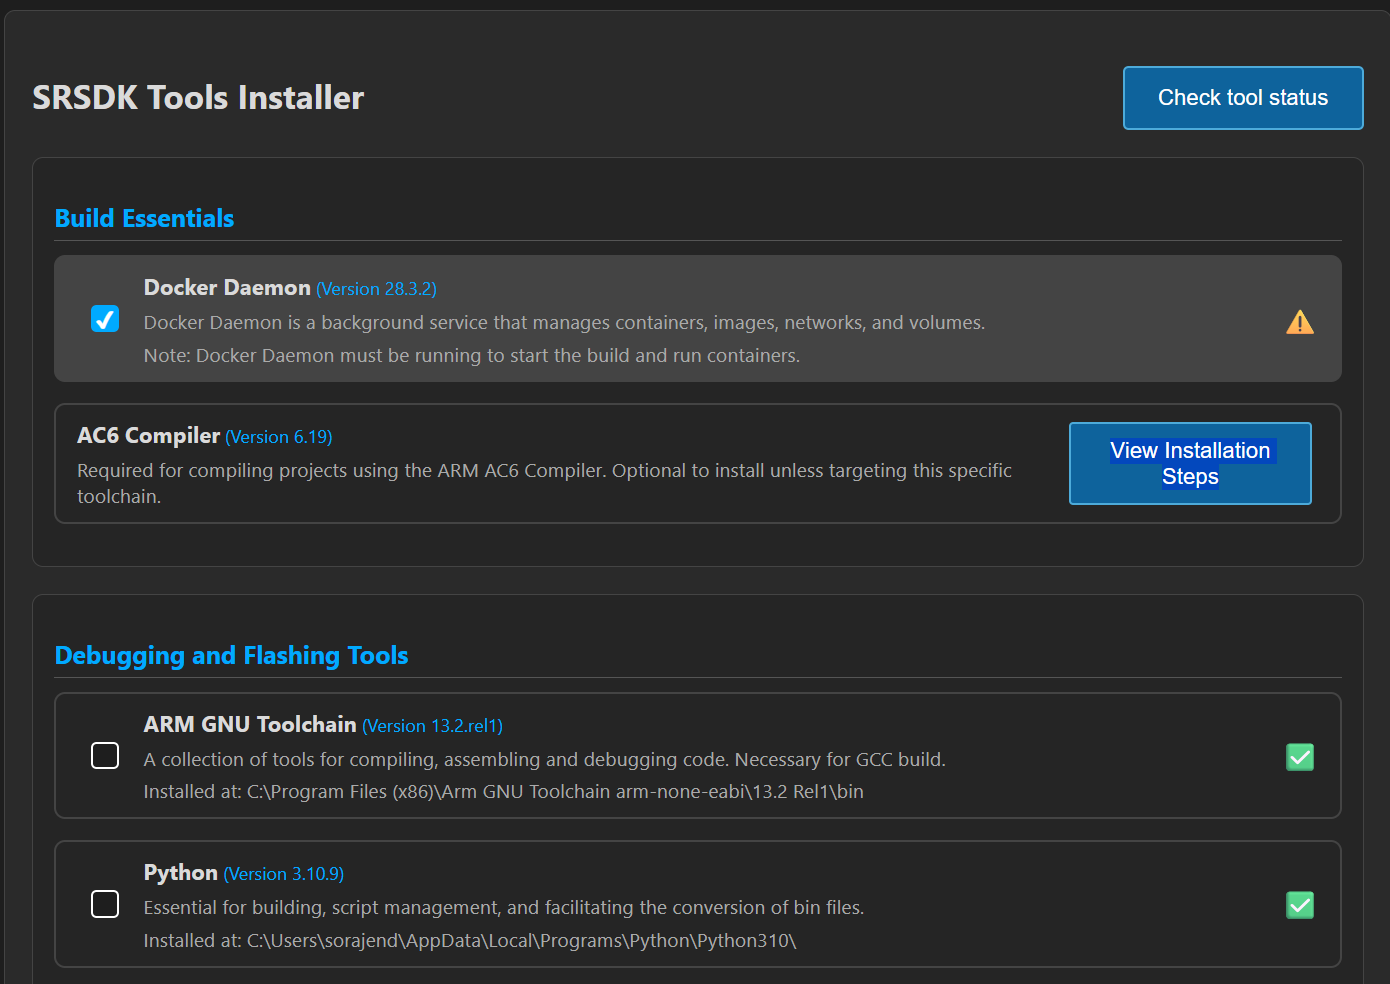
Figure Select Docker Daemon tool
If Docker is not installed, the extension will prompt you. Click Install.

Figure Click Install button
Once complete, Docker Desktop (Windows/macOS) or Docker Engine (Linux) will start.
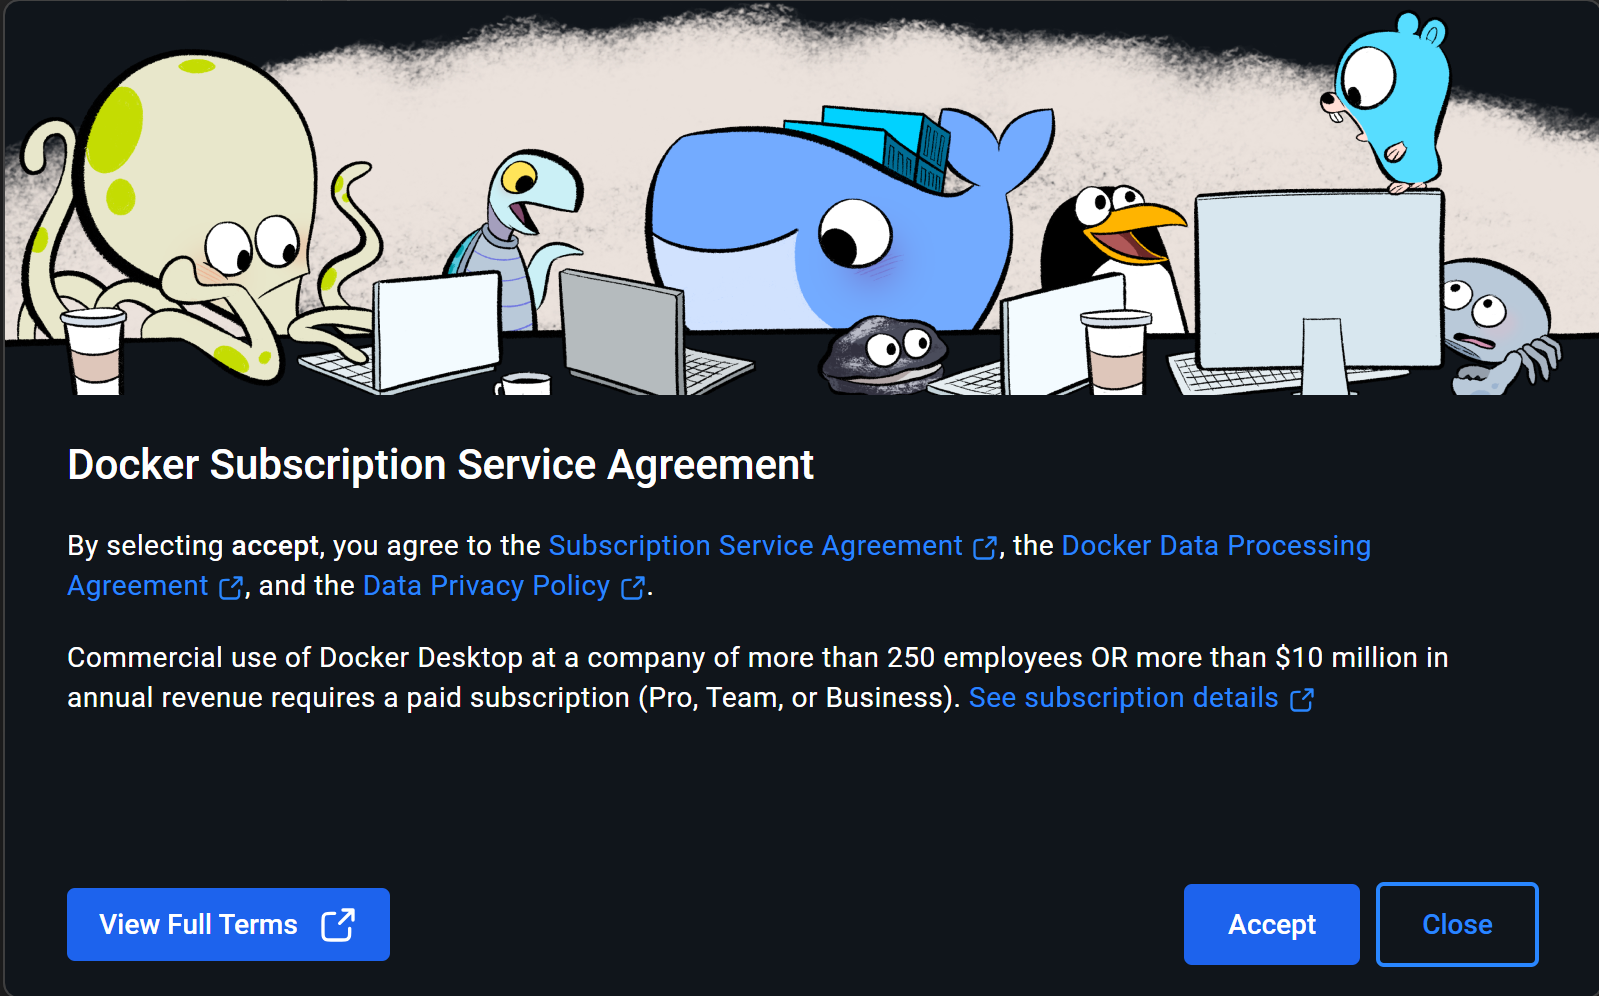
Figure Docker Subscription Service Agreement
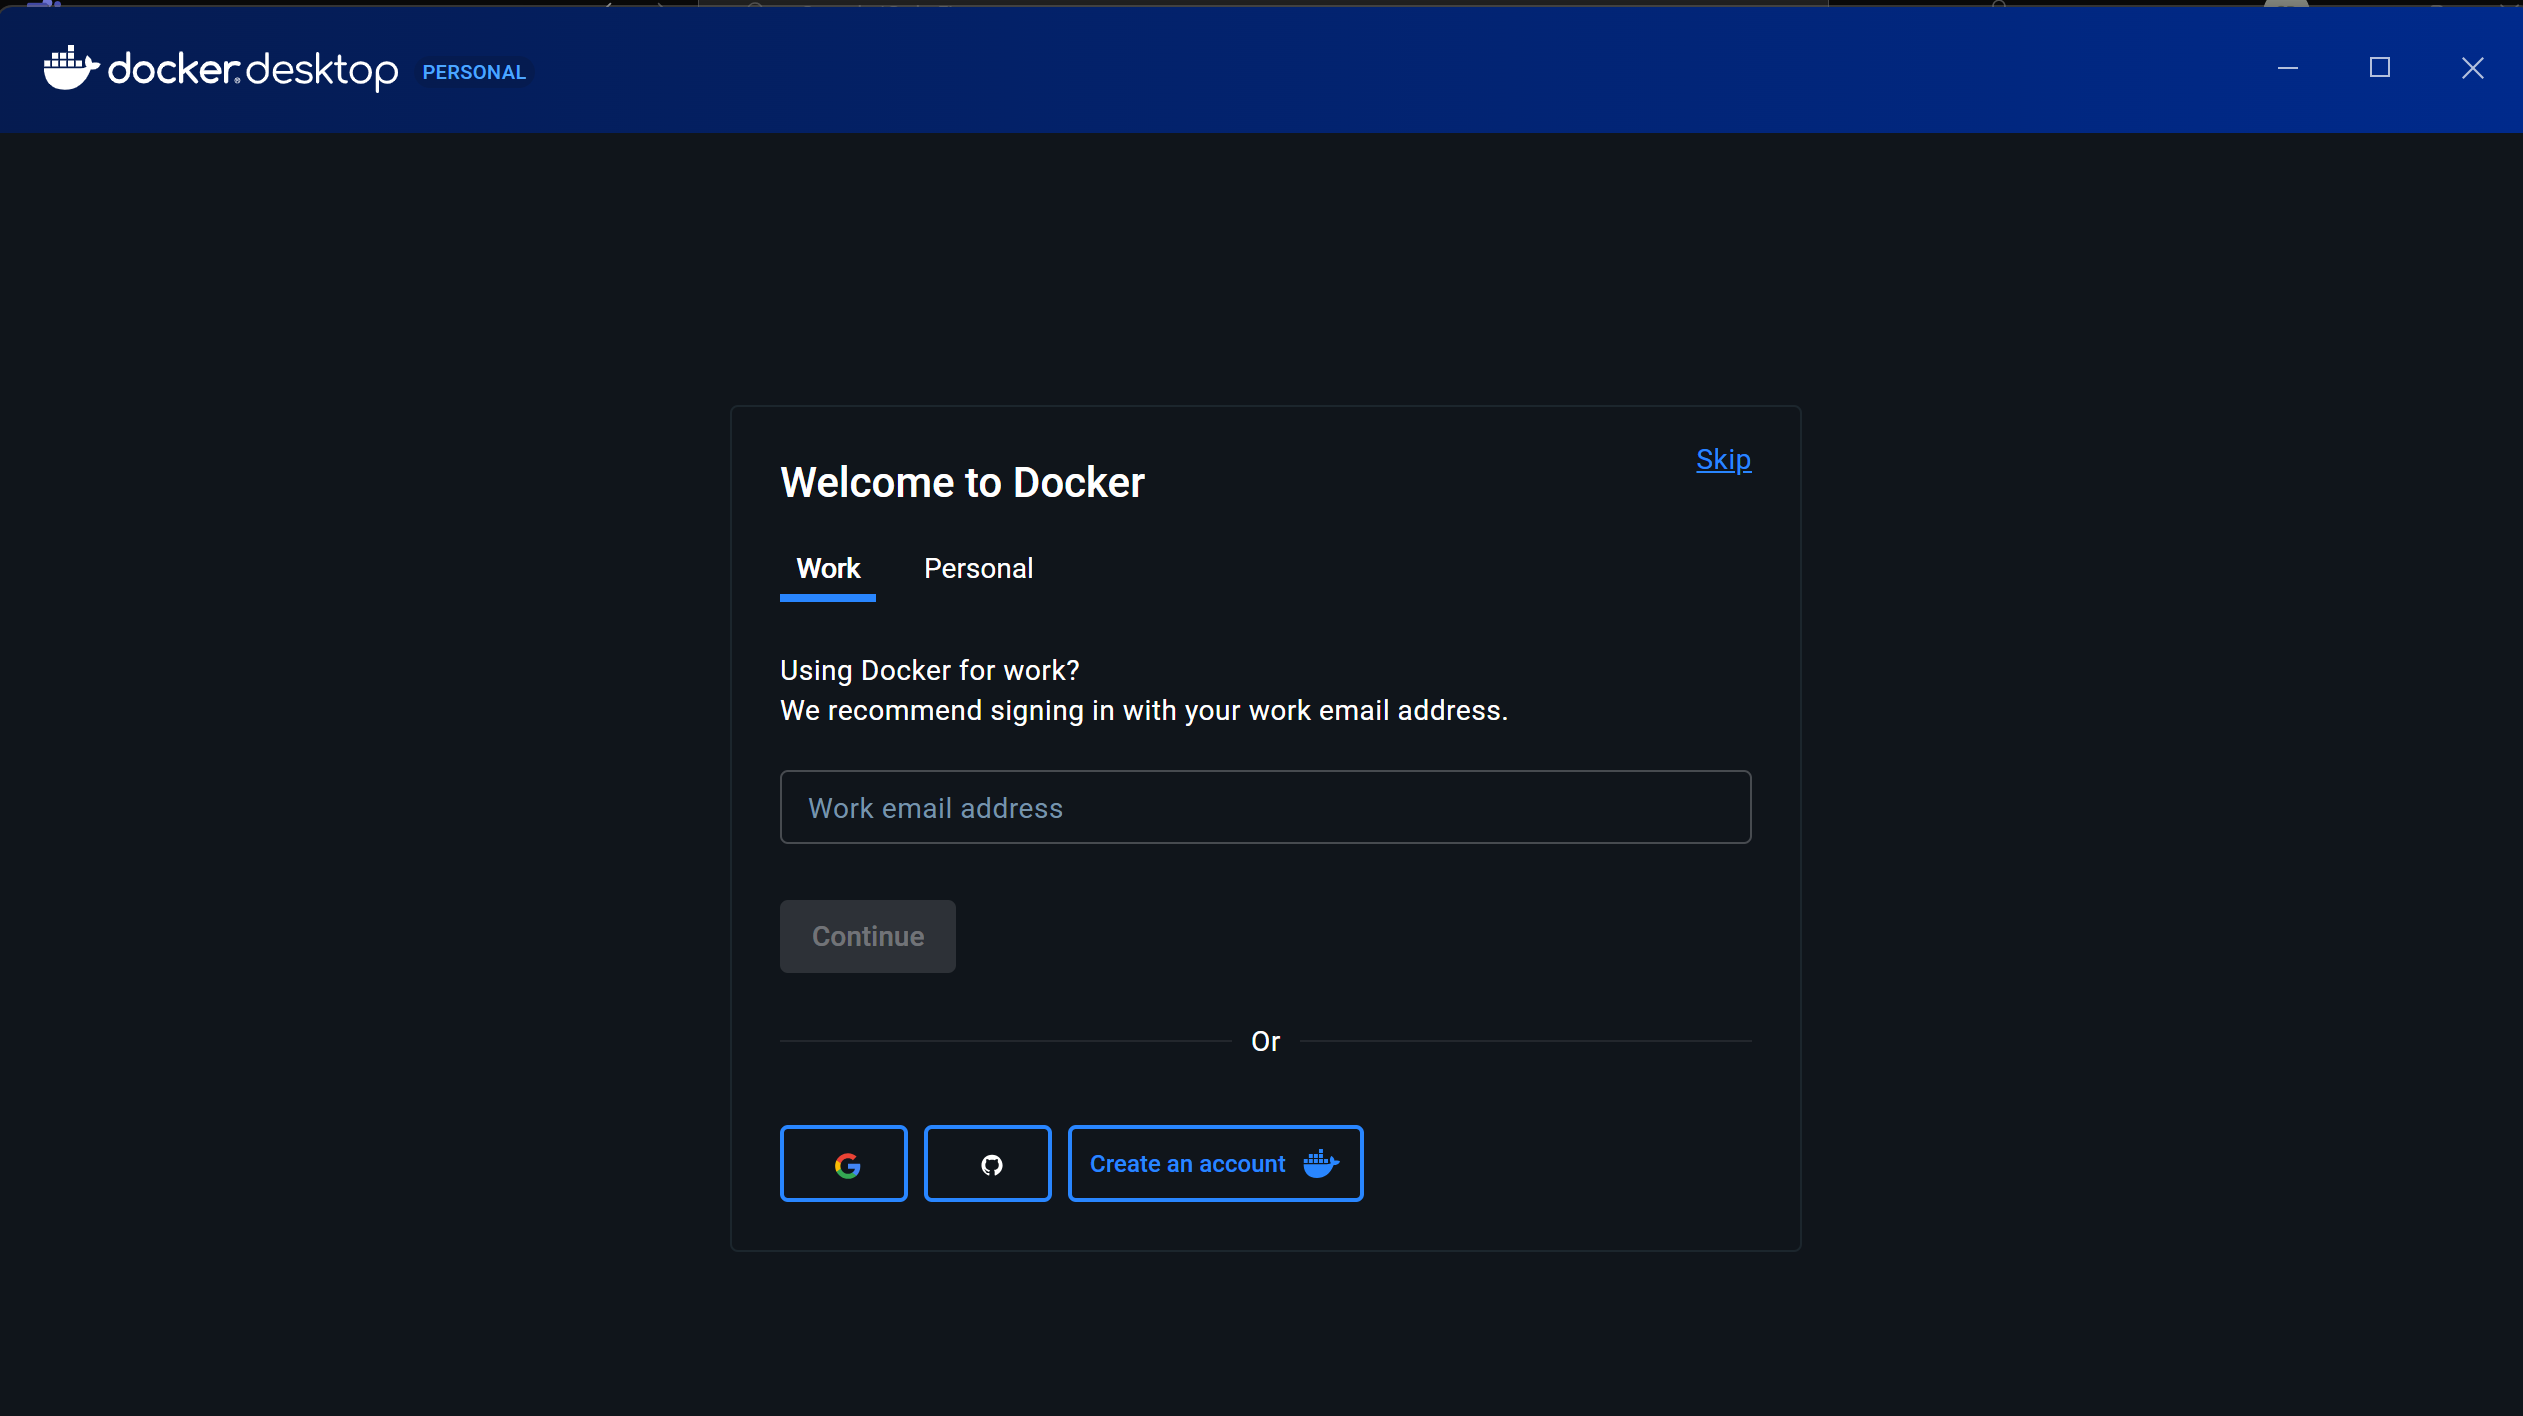
Figure Login into docker account
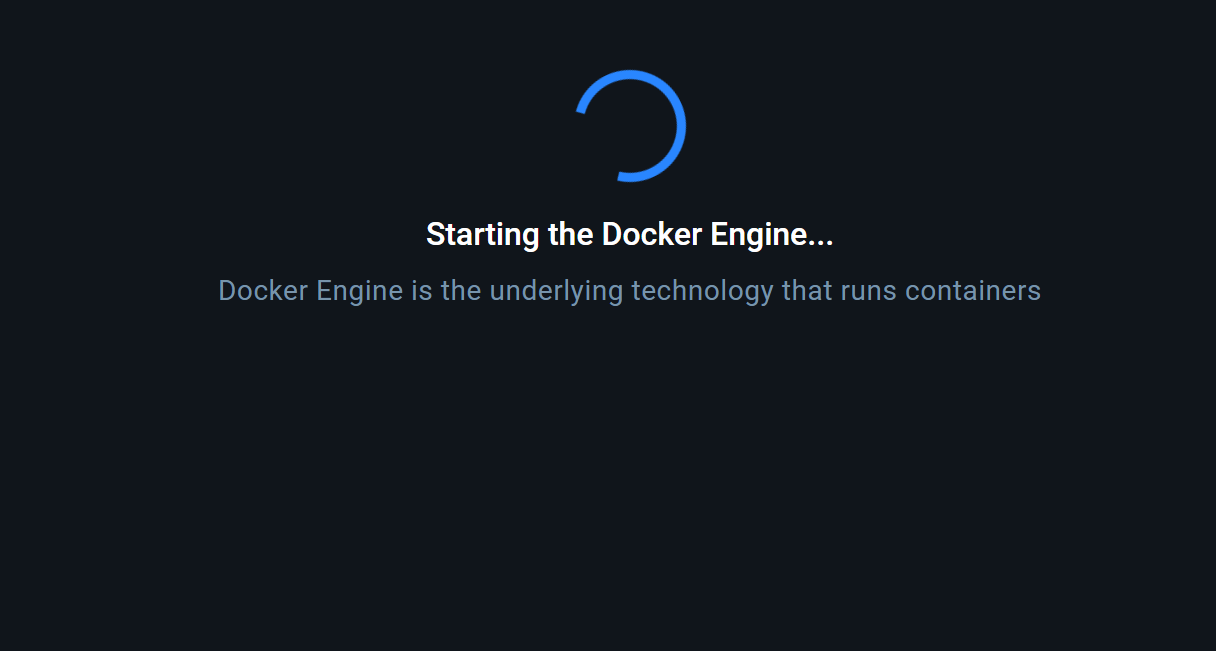
Figure Starting Docker Engine
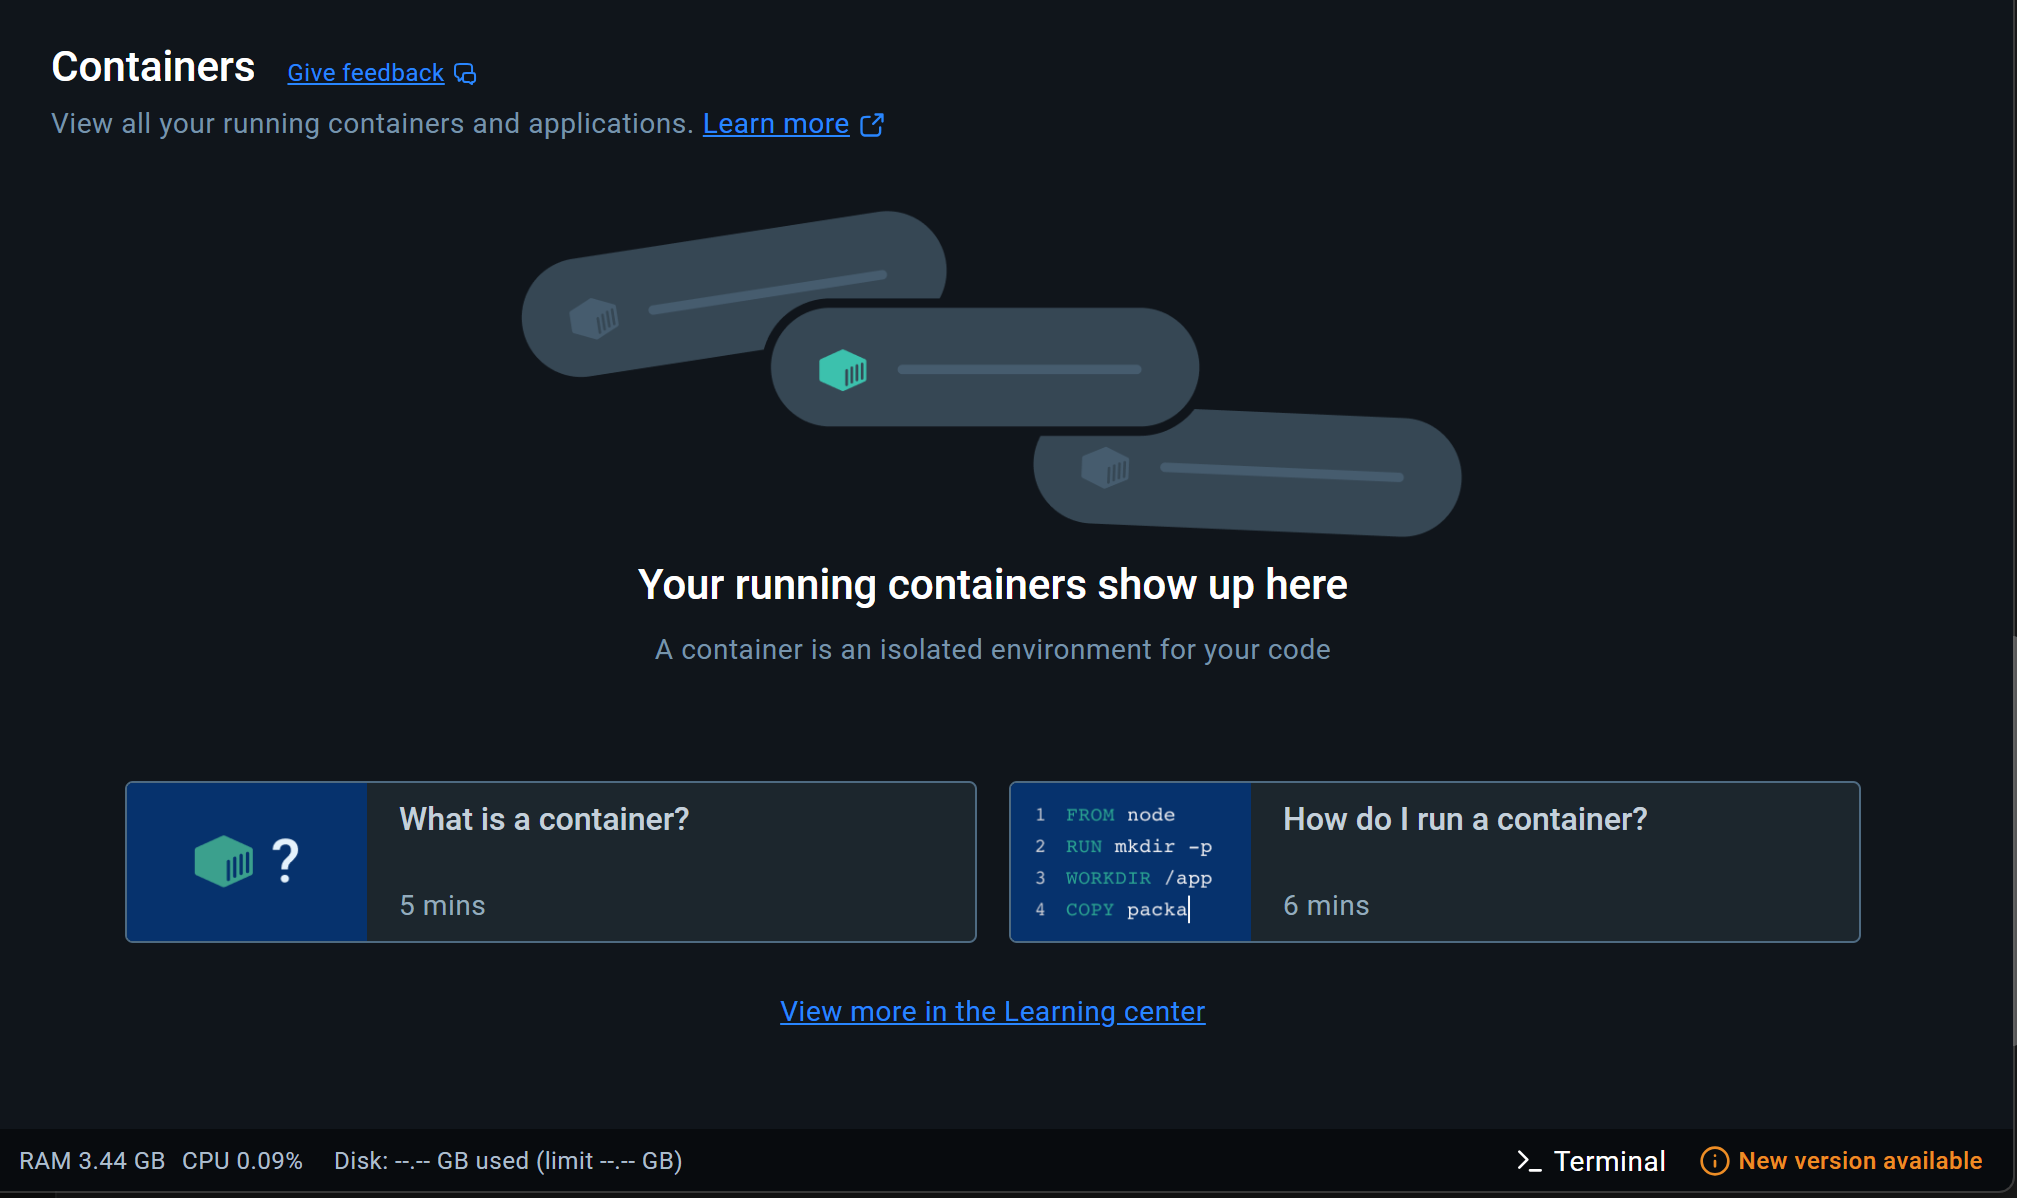
Figure Docker Desktop Dashboard
Troubleshooting (Docker + Astra SRSDK VSCode Extension)
While installing and running Docker via the Astra SRSDK VSCode Extension, some issues may occur depending on system permissions and platform restrictions. The following points cover known issues and their resolutions.
Windows
Installer blocked by admin policies
Symptom: Selecting Docker Daemon Tool → Install downloads Docker Desktop, but the installer does not launch.
Cause: Organization policies block direct execution of installers.
Resolution:
Navigate to the download folder and locate Docker Desktop Installer.exe.
Right-click → Show more options → Run with elevated privileges.
Accept the terms and conditions, skip login if prompted.
Once Docker Desktop starts, the extension will detect it and mark the tool status as Installed.
Extension shows “Please start Docker engine” even after manual install
Symptom: Docker Desktop is installed and running, but the extension does not detect it.
Resolution: Close and reopen VSCode. The extension will refresh its tool detection and start the image build.
Linux
Docker installed, but extension shows “Please start Docker engine”
Symptom: Running docker info gives a permission denied error on /var/run/docker.sock.
Cause: The current user is not yet recognized as part of the docker group.
Resolution:
Verify group membership: groups $USER.
If docker is listed but still failing, reboot the system so group changes take effect.
After reboot, rerun docker info to confirm.
macOS
Full Disk Access required
Symptom: Docker Desktop or VSCode fails to start containers or access mounted paths.
Resolution:
Open System Settings → Privacy & Security → Full Disk Access.
Enable Full Disk Access for both Visual Studio Code and Docker Desktop.
Restart both apps and retry the operation.
General Notes:
In environments with strict IT restrictions (admin blocks, policy-enforced executables), the automated installation may fail. In such cases, use the manual installation method and then restart VSCode for the extension to detect Docker correctly.
Result:
The selected tools will be installed into the specified folder and the toolpaths will be stored in temporary settings.json file. This will be used to configure the workspace environment when an Astra MCU SDK is imported.
After installation, the tools checking will automatically run to update the status of tools.
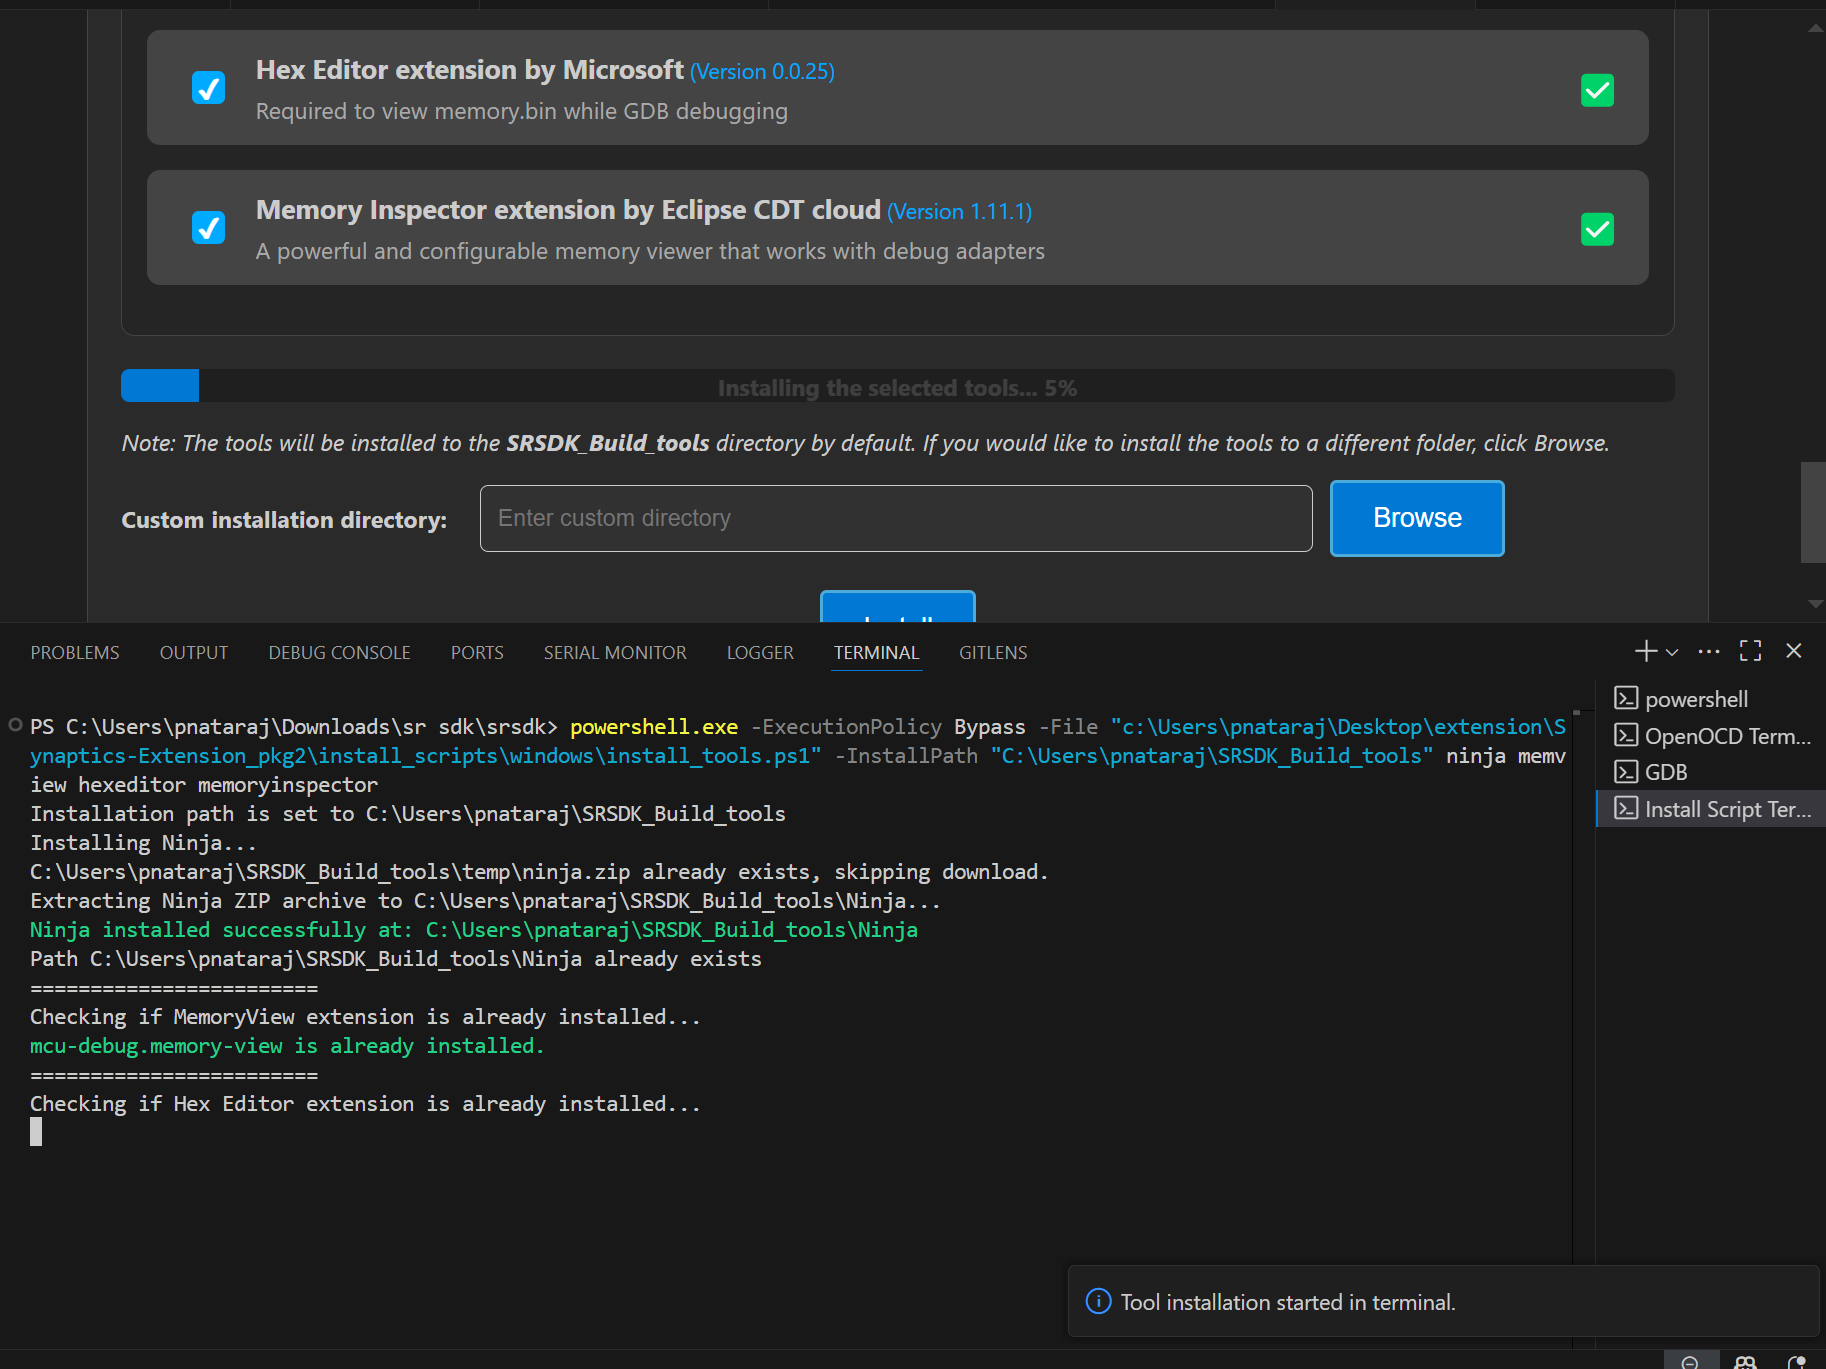
Figure Tools Installation
Source Code Checkout
Purpose: This option is to enable users to check out the Astra MCU SDK from either local or remote (from GitLab).
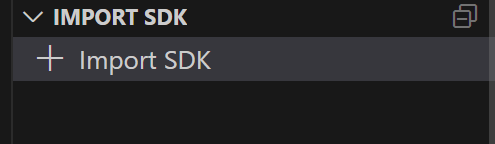
Figure Import SDK
Steps:
Click on the “Import SDK” button under the IMPORT SDK view.
This will open the web view to import SDKs both from local and remote repositories.
- Local Import: Under “LOCAL” tab, click on the “BROWSE” button and select the Astra SRSDK to import. This action will import the Astra SRSDK and add it to the workspace.
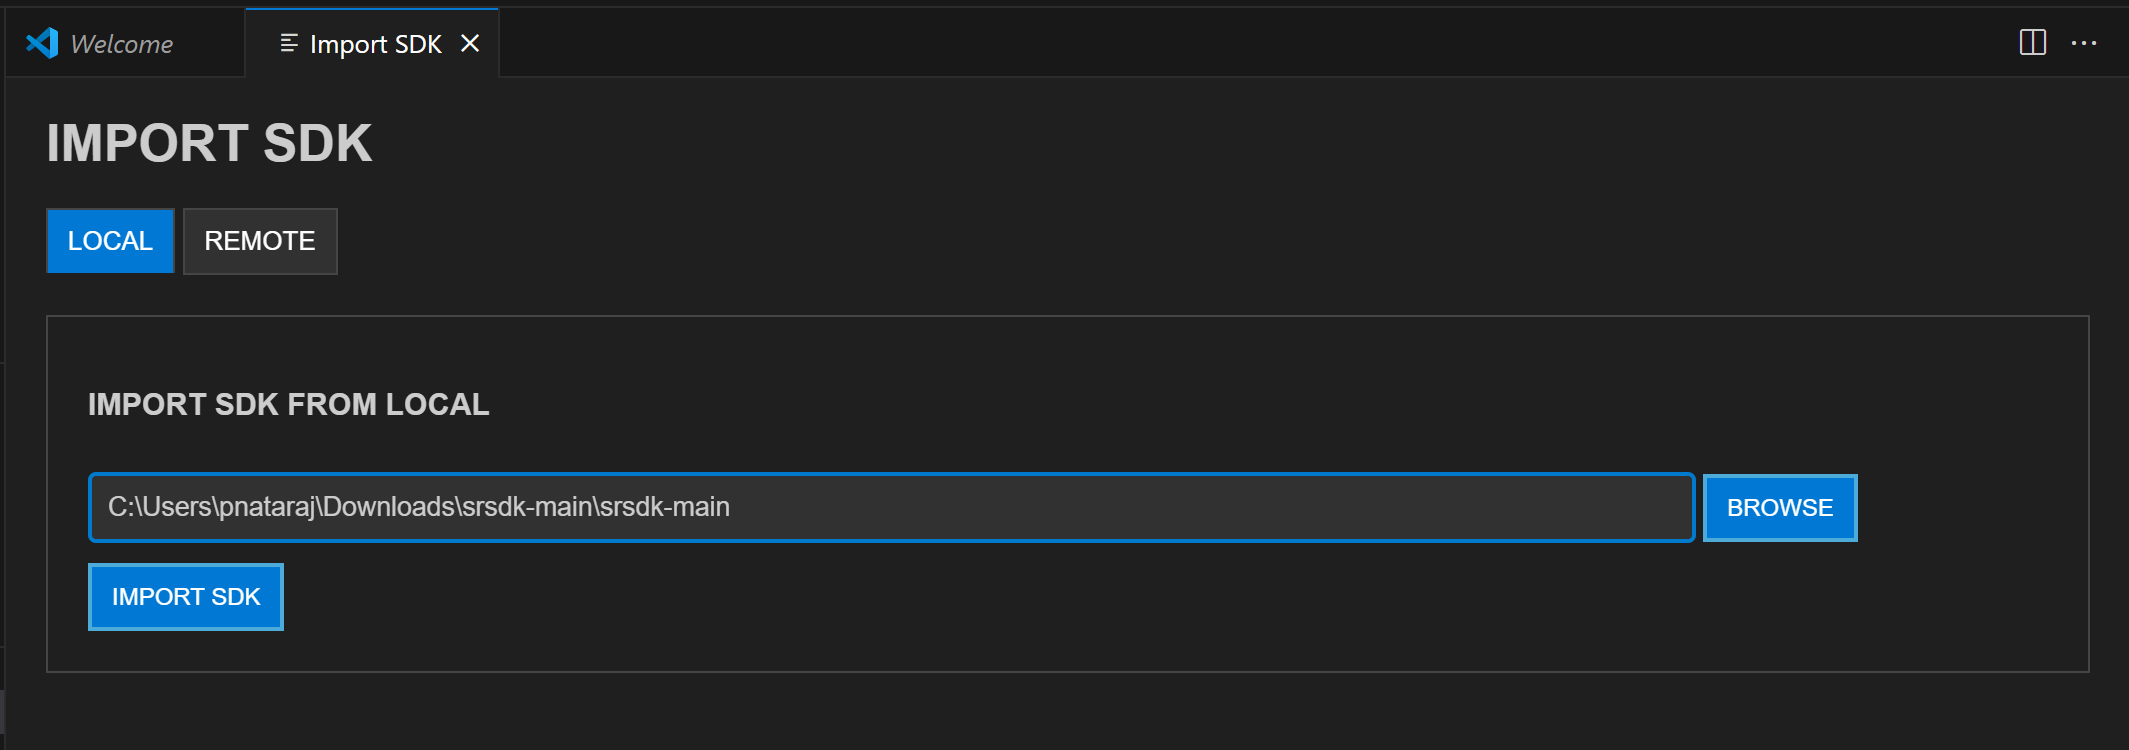
Figure Import SDK from local
- Remote Import: Under the “REMOTE” tab, click on “CLONE REPO”, paste the repository URL to clone and then select the folder/location to clone into. GitLab needs proper SSH key setup. Cloning large repositories will take time. After cloning, the repository will be imported and added to the workspace in the “Imported Repos”.
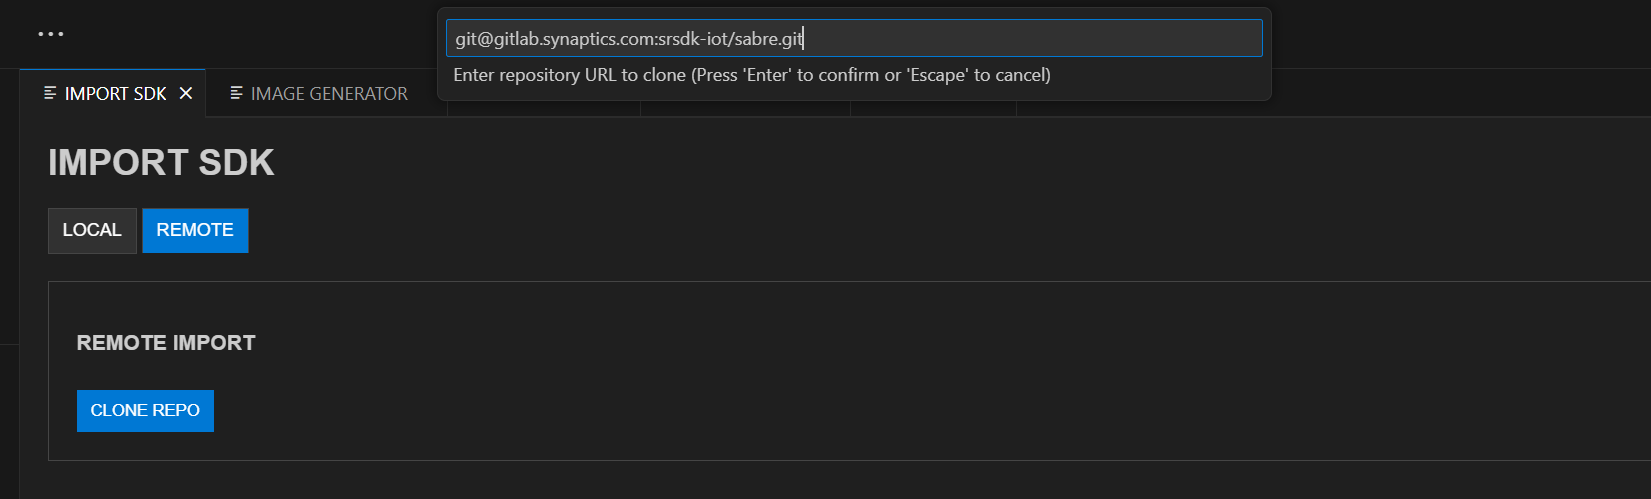
Figure Import SDK from remote
Once the Astra SRSDK is added to the workspace, tool paths will be set in the settings.json. If settings.json doesn’t exist, it will be created; if it does, it will be modified accordingly.
Note: The settings.json, which is updated during tools installation, is used to configure workspace-specific settings such as paths and environment variables needed for proper Astra SRSDK integration and development.
Imported Repos
Purpose: Provides a quick interface for managing the imported Astra MCU SDK and offers essential actions.
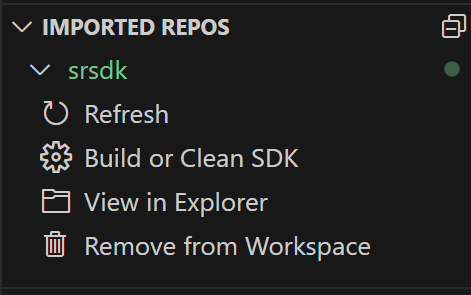
Figure Imported Repos
Options:
Refresh: Will reload the current workspace.
Build or Clean SDK: Provides an interface to select necessary options and trigger a build or clean of the Astra SRSDK, with the build process executed inside Docker container.
View in Explorer: To open the current Astra SRSDK in explorer.
Remove from Workspace: To remove the currently imported Astra MCU SDK from the workspace.
Note: Currently, only one Astra SRSDK can be imported at a time. Importing multiple SDKs in same workspace is not supported yet.
Docker Setup
Purpose: To setup docker and run container.
Install Docker Desktop and ensure the Docker engine is running.
After installation, click Refresh in the VS Code extension to start the Docker setup (this step is required only once).
The extension will check for an existing Docker image.
If none is found, it will build one using the provided Dockerfile (image build is a one-time process).
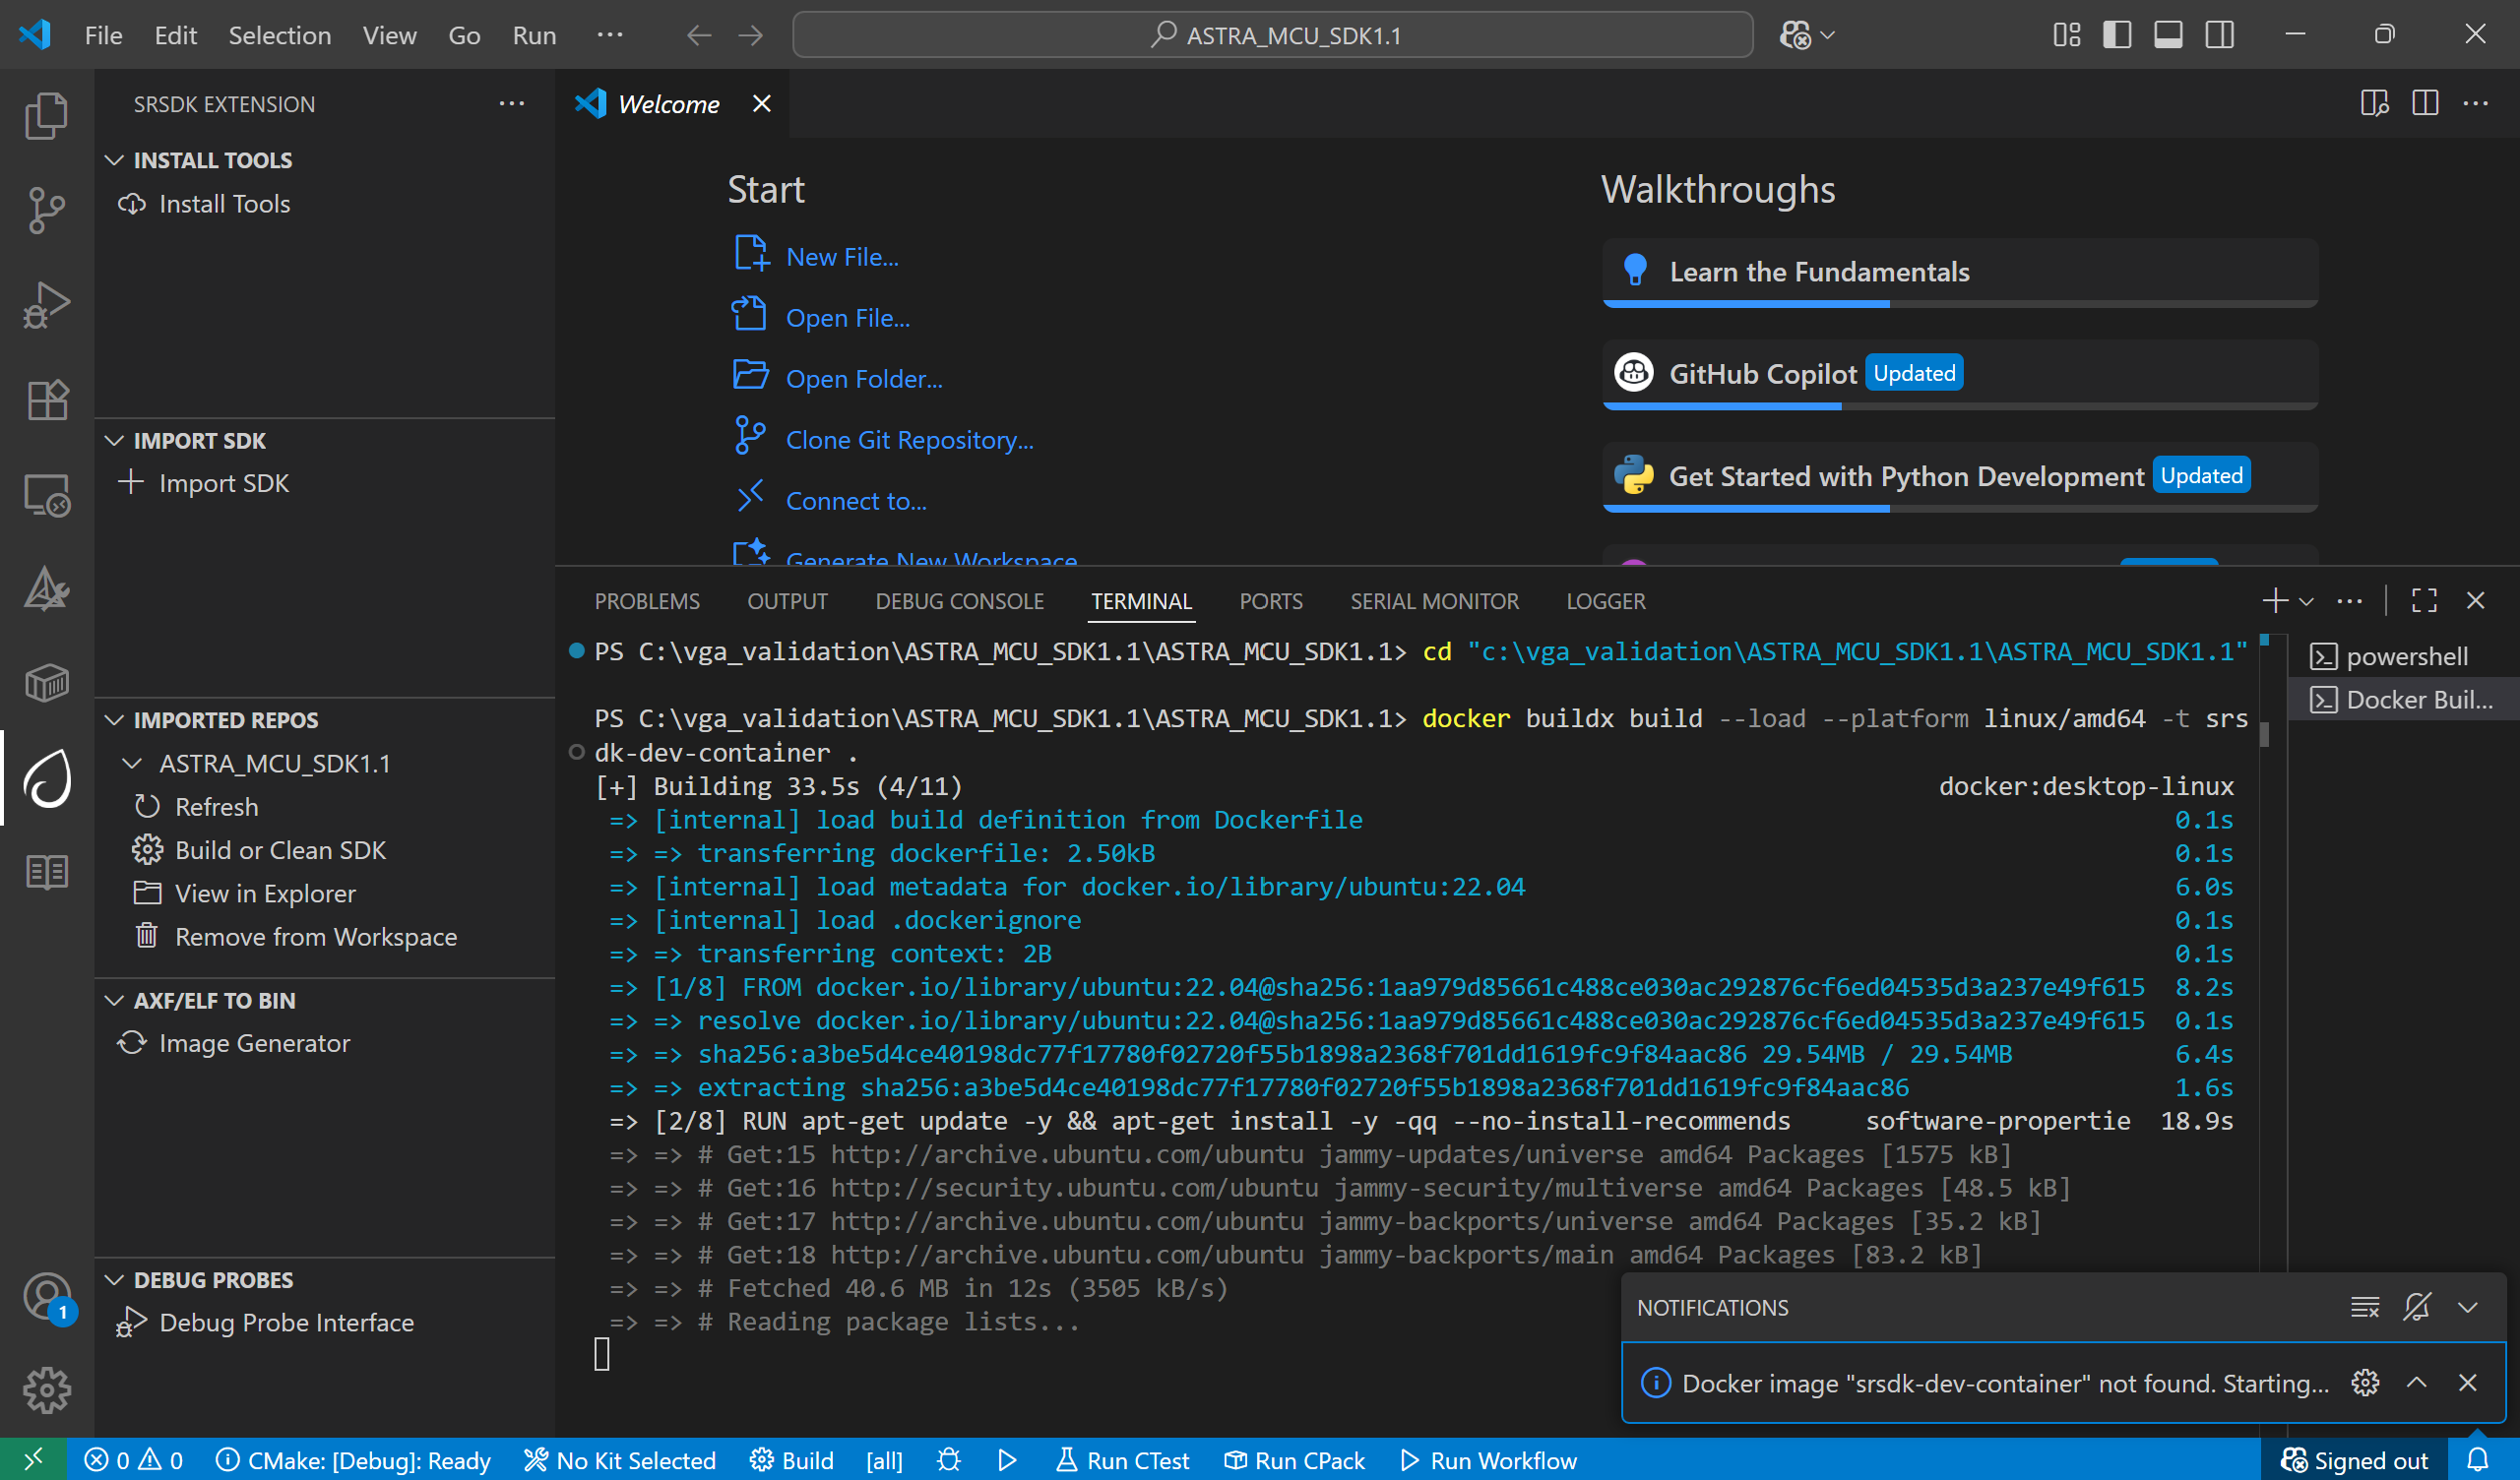
Figure Docker Image Build
On subsequent uses, only the container will run — the image will not be rebuilt unless required.
Once the container starts, the SDK’s root directory will be mounted into it.
When the container is running, you’ll see a notification: “Docker setup is ready”.
Note:
- By default, Docker Desktop installs WSL 2 and a Linux distribution
(like Ubuntu) during setup if it’s missing.
Build Functionality
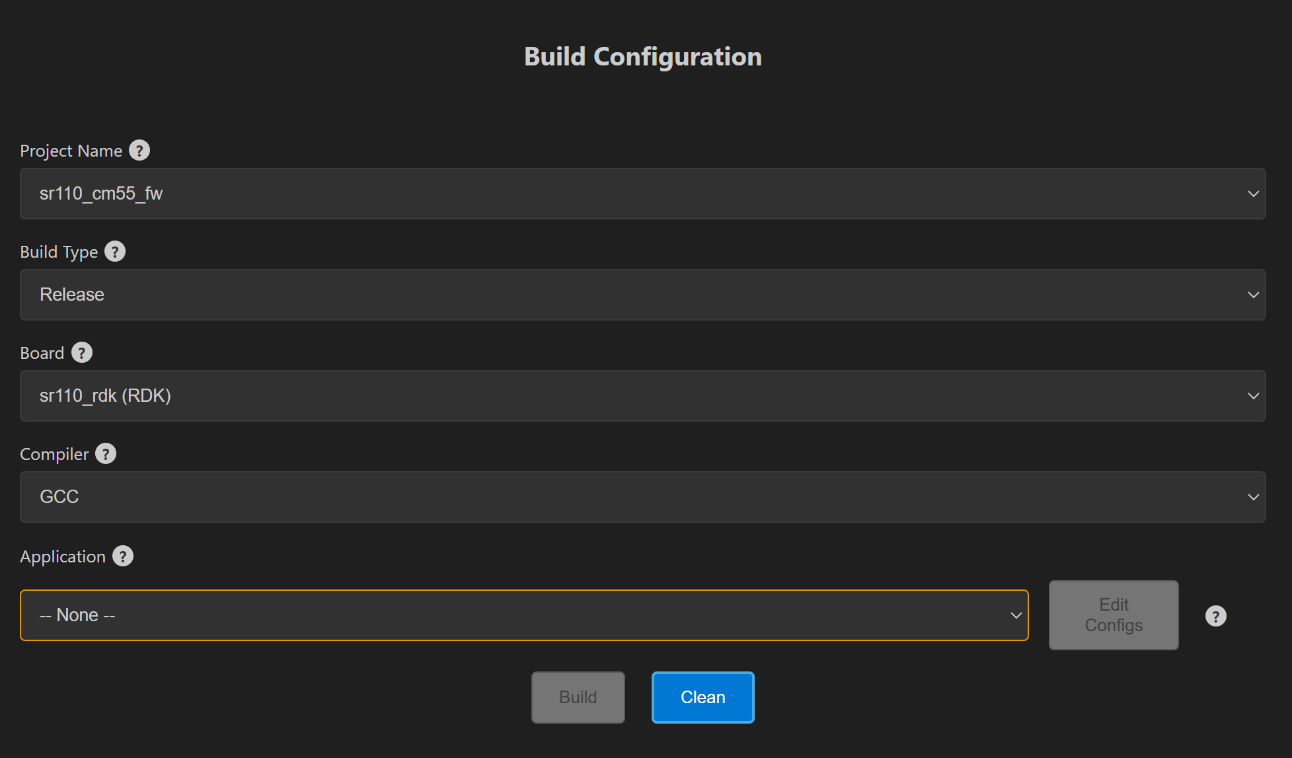
Figure Build Webview
Steps:
Once the required Astra SRSDK is imported, within Imported Repos column, click on “Build or Clean SDK”. This will open the build Webview. Make sure the imported folder is correct, typically the one containing the Makefile.
Select appropriate build configurations. The currently supported configurations are as follows:
Project Type: sr110_cm55_fw, sr110_b0_bootloader, tflite_micro
Build Type: Release, Debug, UnitestDebug
Board: sr110_rdk
Board Revision: Rev A, Rev B, Rev C
Compiler: AC6 and GCC
Use a Release build when the binary is intended to be flashed onto the device. A Debug build generates an .axf/.elf file with debug symbols, making it suitable for debugging purposes. Choose the UnitestDebug build option to generate an .axf/.elf file that can be used for running Unity tests.
According to the selected “Project Type”, the specific applications will be populated in the “Applications” dropdown. Initially the “Edit configs” and “Build” buttons will be disabled. Once a proper Application is selected and applied from the dropdown, these buttons will be enabled.
When AC6 is selected as the compiler, a prompt will appear requesting the AC6 License query value. Enter the value and click OK to set the license and begin the AC6 build.
License Query Format:ARMLM_ONDEMAND_ACTIVATION=<LICENSE_KEY>@http://<SERVER_ADDRESS>:<PORT>
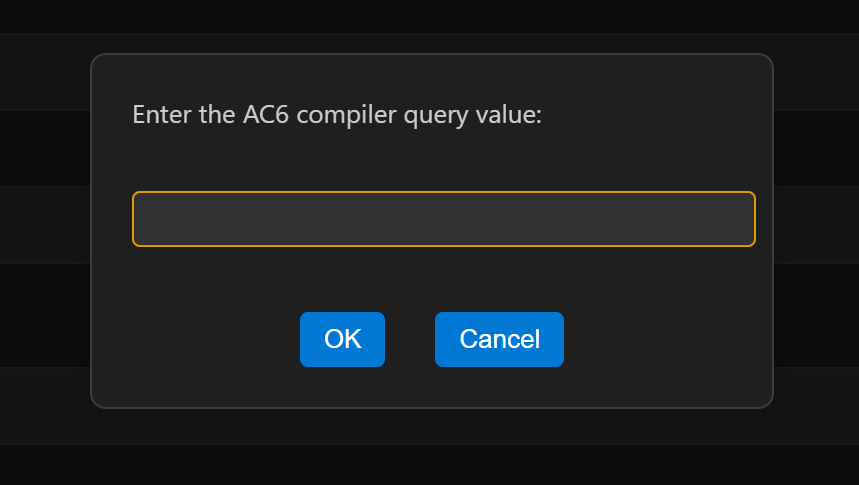
Figure AC6 compiler dialog box
- Application: Select the application to be loaded from the dropdown.
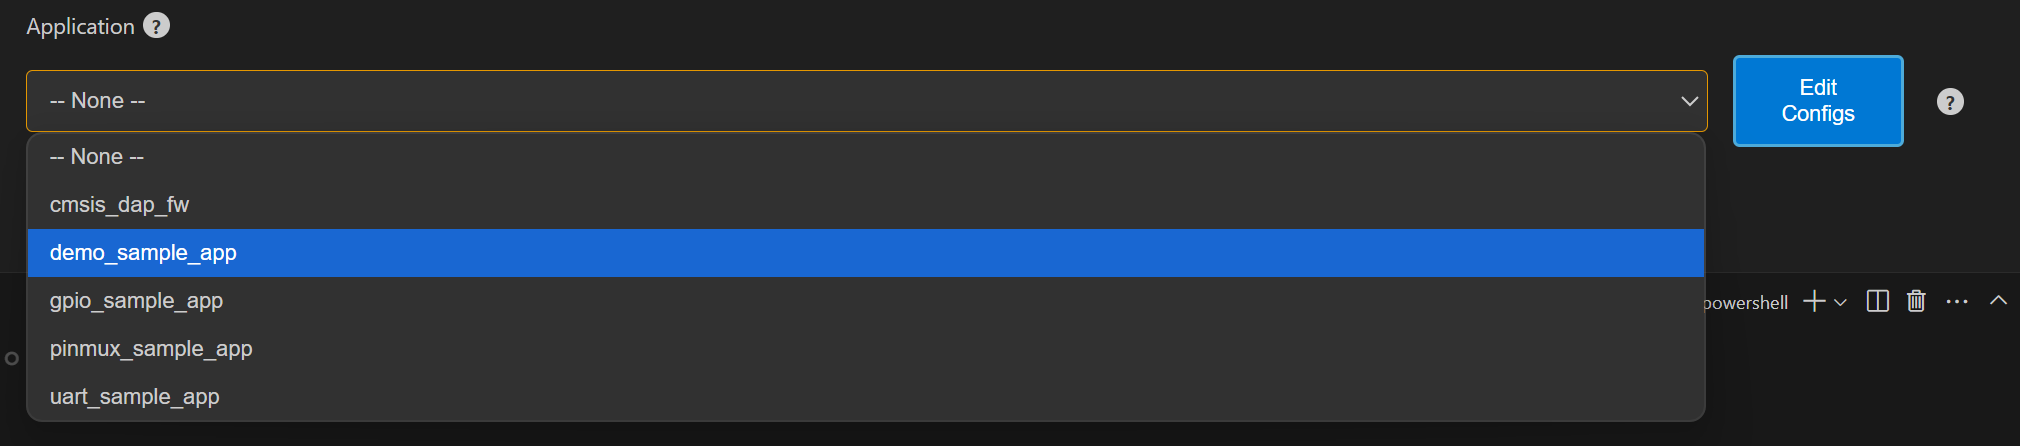
Figure Application dropdown
- Edit Configs: The edit configs button will open the menuconfig layout in the terminal. Users can set the appropriate configurations using this menu.
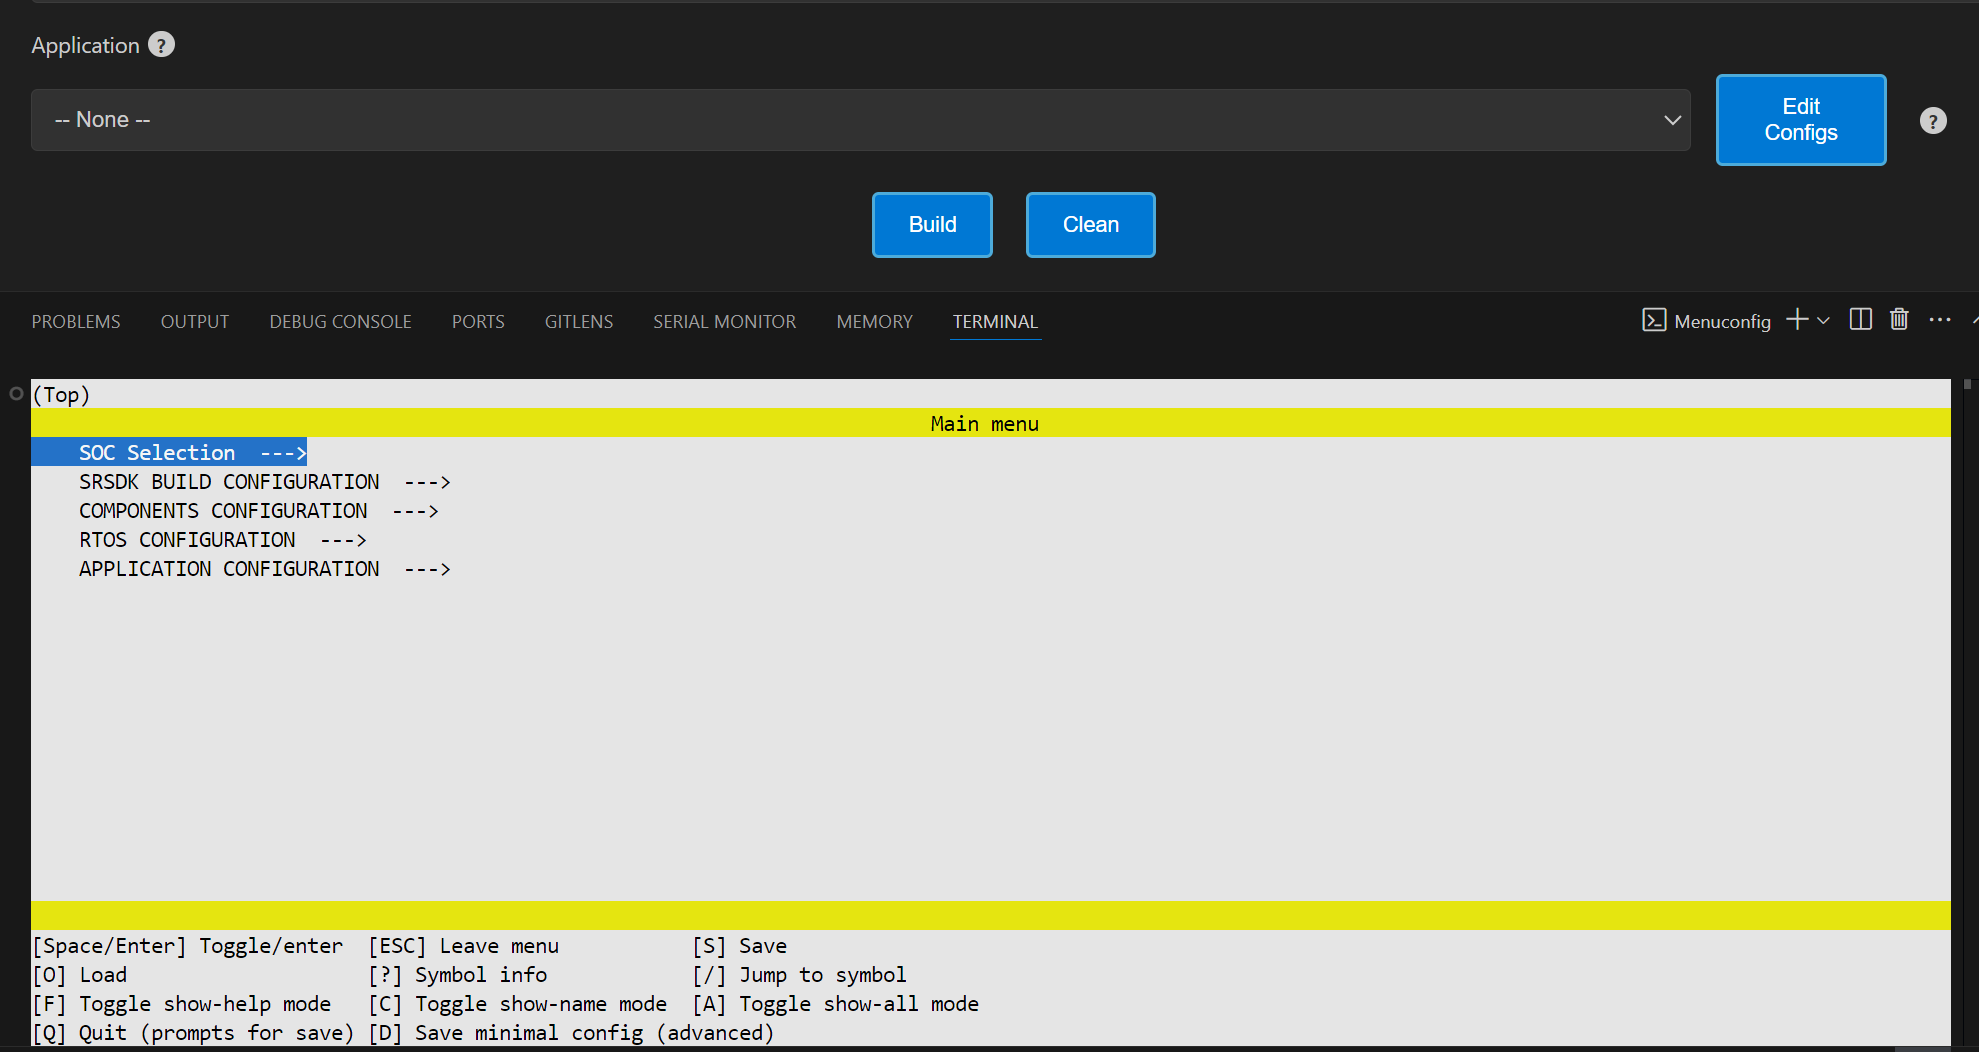
Figure Edit Config view
- Once the configs are edited and saved to .config, users have the option to save their custom defconfig. A prompt for saving the custom defconfig will appear like shown in below figure.
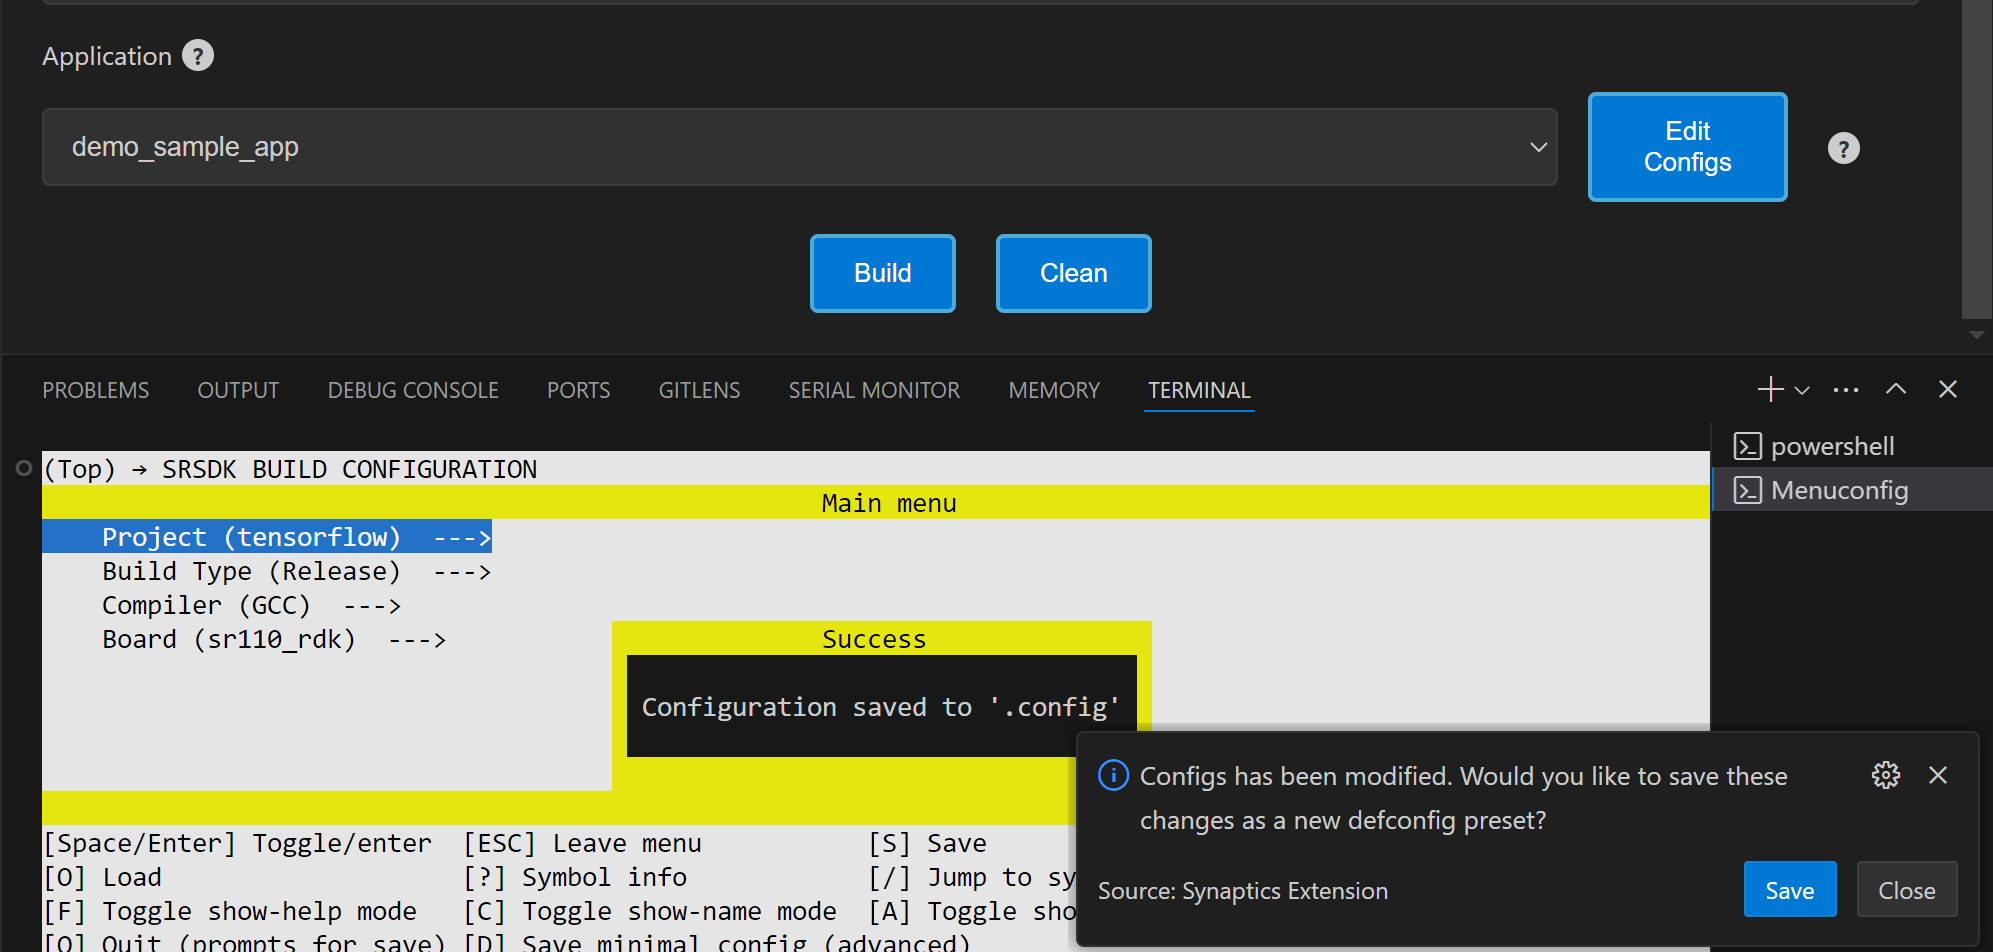
Figure Prompt to save custom defconfig
Then users need to enter a filename under which the defconfig should be saved. Once given, the custom defconfig will be saved to <parent directory>/examples/configs folder.
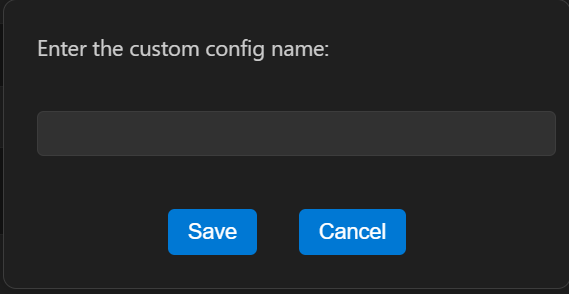
Figure Save defconfig dialog box
To change board revisions, after selecting the necessary application, click “Edit Configs” > select “SRSDK BUILD CONFIGURATION” > select “Board” > select “RDK Revisions” and choose appropriate revision and save the configuration.
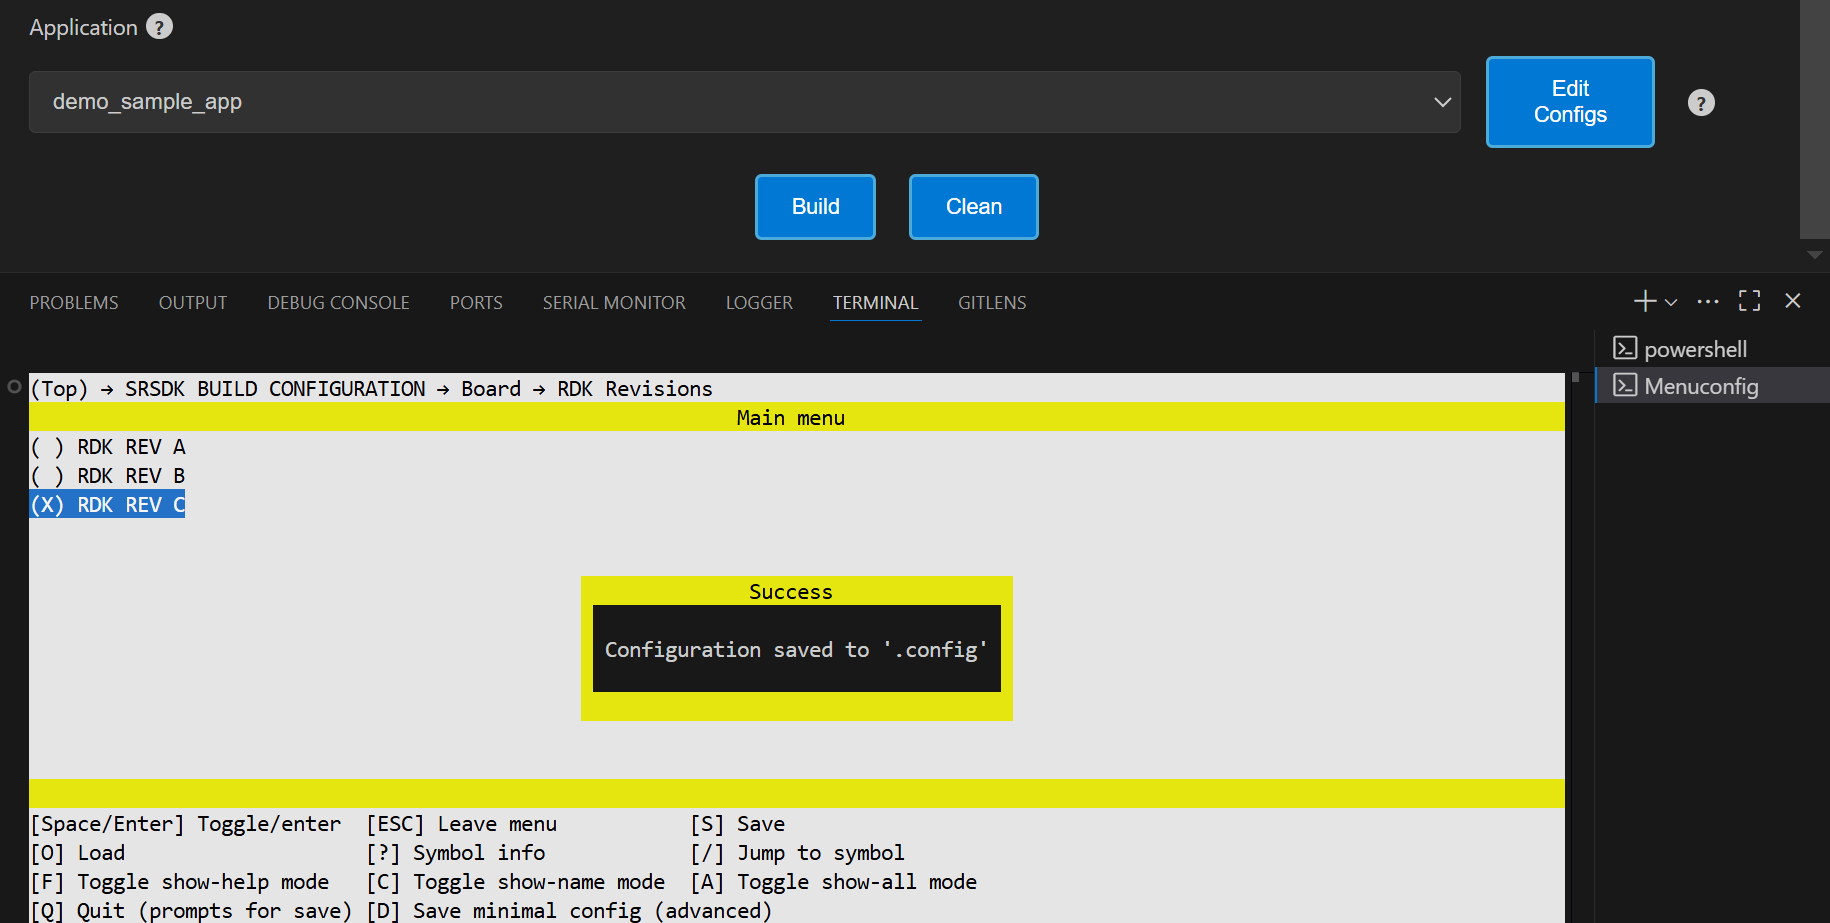
Figure Board revision selection
Once the necessary configs are set, click the Build button. The build will run inside the Docker container, with all output logs displayed in the terminal in real time.
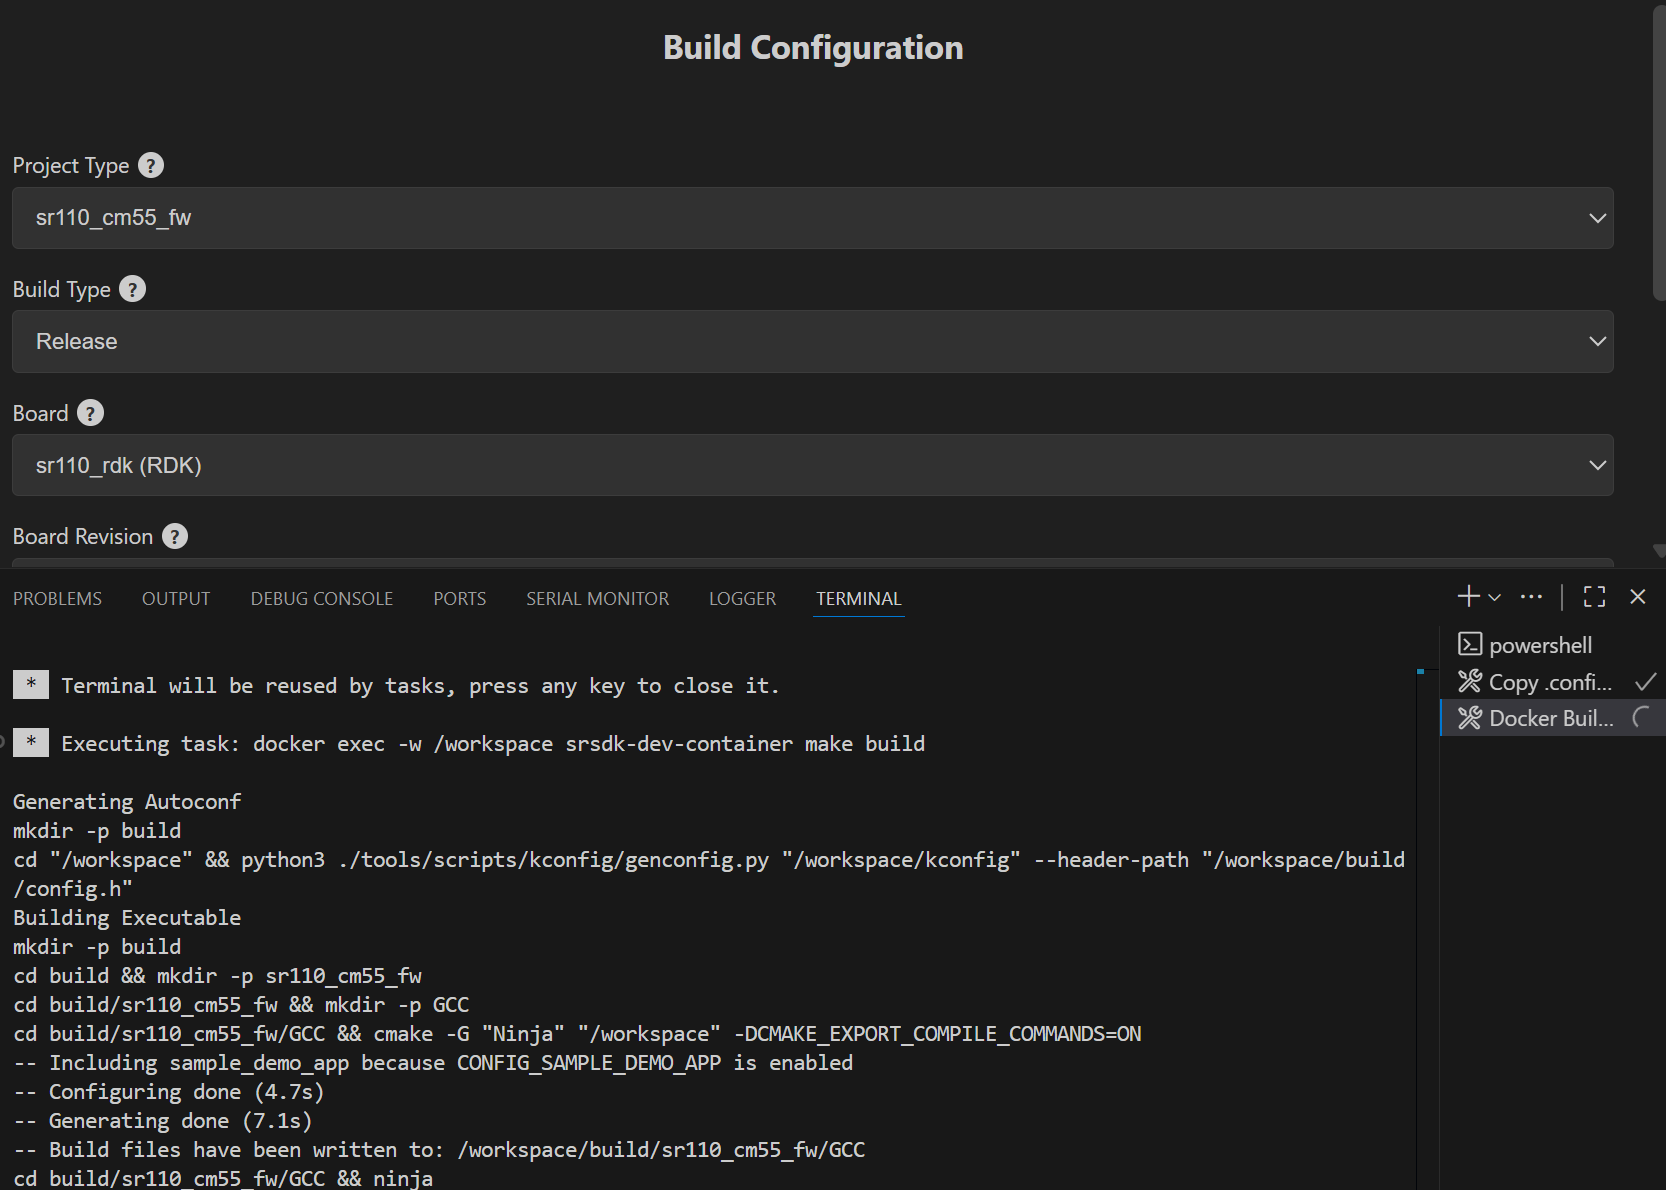
Figure Build log in terminal
Result:
The generated axf/elf files can be found at /Astra_MCU_SDK/out/ directory. Upon a successful Release build, the AXF/ELF file path is automatically populated in the IMAGE GENERATOR tab. Similarly, after a successful Debug build, the file path is automatically populated in the DEBUG PROBES tab.
Clean the SDK: Similarly, the Astra SRSDK can be cleaned by clicking the “Clean” button. The logs will be displayed in the terminal.
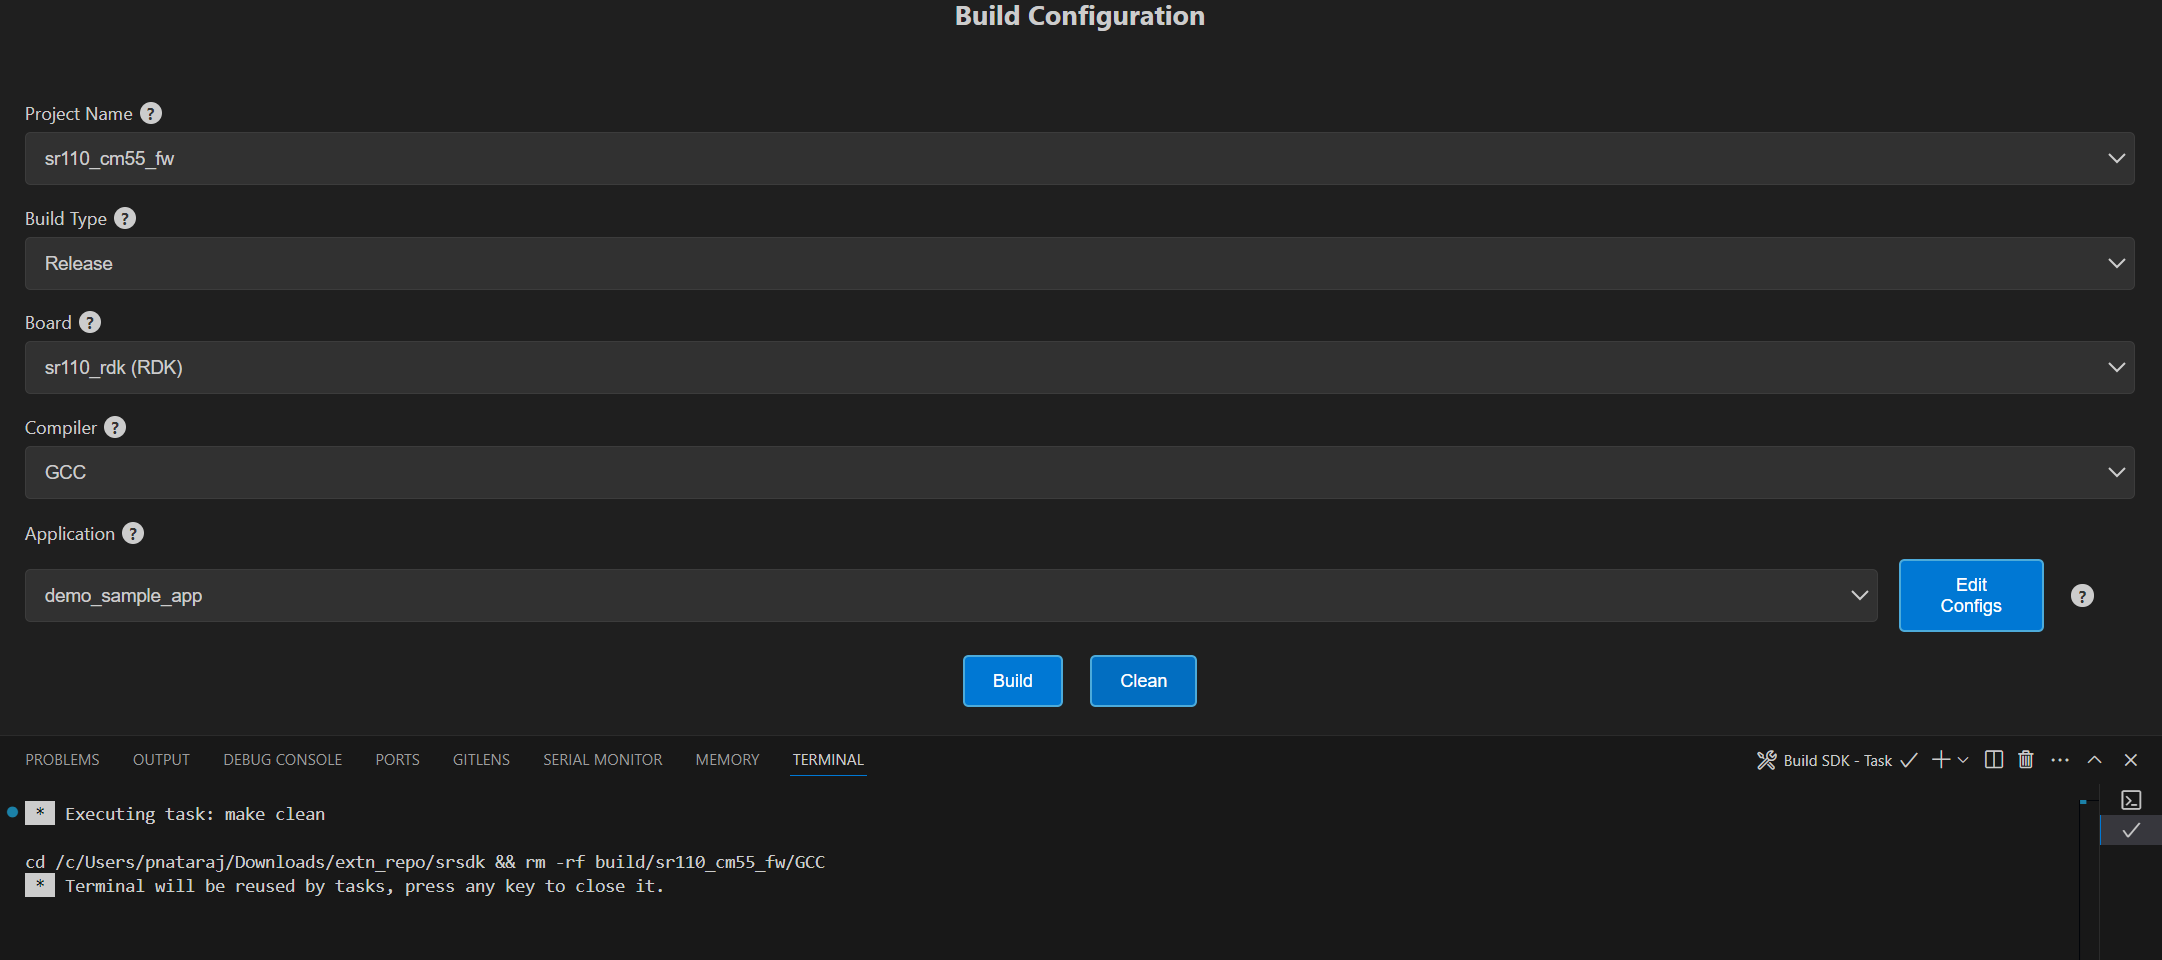
Figure Clean SDK logs
Image Generation
Purpose: This window will enable users to convert the axf/elf file generated after the build process to be converted into binary files and will aid in model bin conversion.
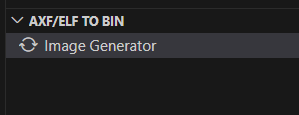
Figure Image Generator
Image Conversion – Basic Configurations
Steps:
Click on the “Image Generator” button. It will open a web view for Image Generation.
In the web view, already the Release build file path will be pre-populated (if already built for Release option). Also, the user can select a custom axf/elf file for converting using the “Browse” button.
The necessary options need to be selected for converting axf or elf to bin.
Default options for converting axf/elf to bin – select Flash Image or Host Image checkbox and select Secured Image checkbox.
Host Image – The binary which will be flashed to the RAM memory of the chip.
Flash Image – The binary which will be flashed to the Flash memory of the chip.
Secure – select this checkbox if the chip in use is secured; otherwise, leave it unchecked.
Users can also specifically select the “Flash Type” (default is GD25LE128) and “Flash Frequency” (default is 67) values from the dropdown once the Flash checkbox is selected.
For generating both Host and Flash images, select both Host and Flash Image checkboxes.
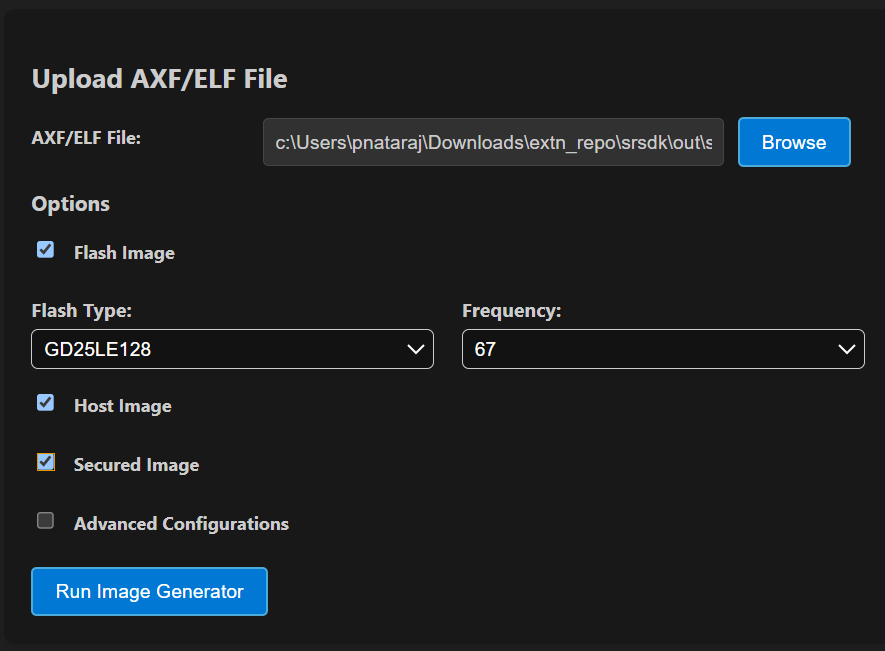
Figure Image Conversion options
Image Conversion – Advanced Configurations
Steps:
Select the “Advanced Configurations” checkbox to reveal the advanced selections. Here users can select custom SPK and APBL file paths using the respective “Browse” buttons.
Model Bin Conversion: This option enables the conversion of vela model file into binary file. Select the Vela model binary using the “Browse” button and choose “Secure” according to the model.
Edit JSON file: Enables users to open and edit the JSON files.
Once the options are selected, click on the ‘Run Image Generator’ button. This will start the conversion process, and the conversion logs will be shown in the Output window.
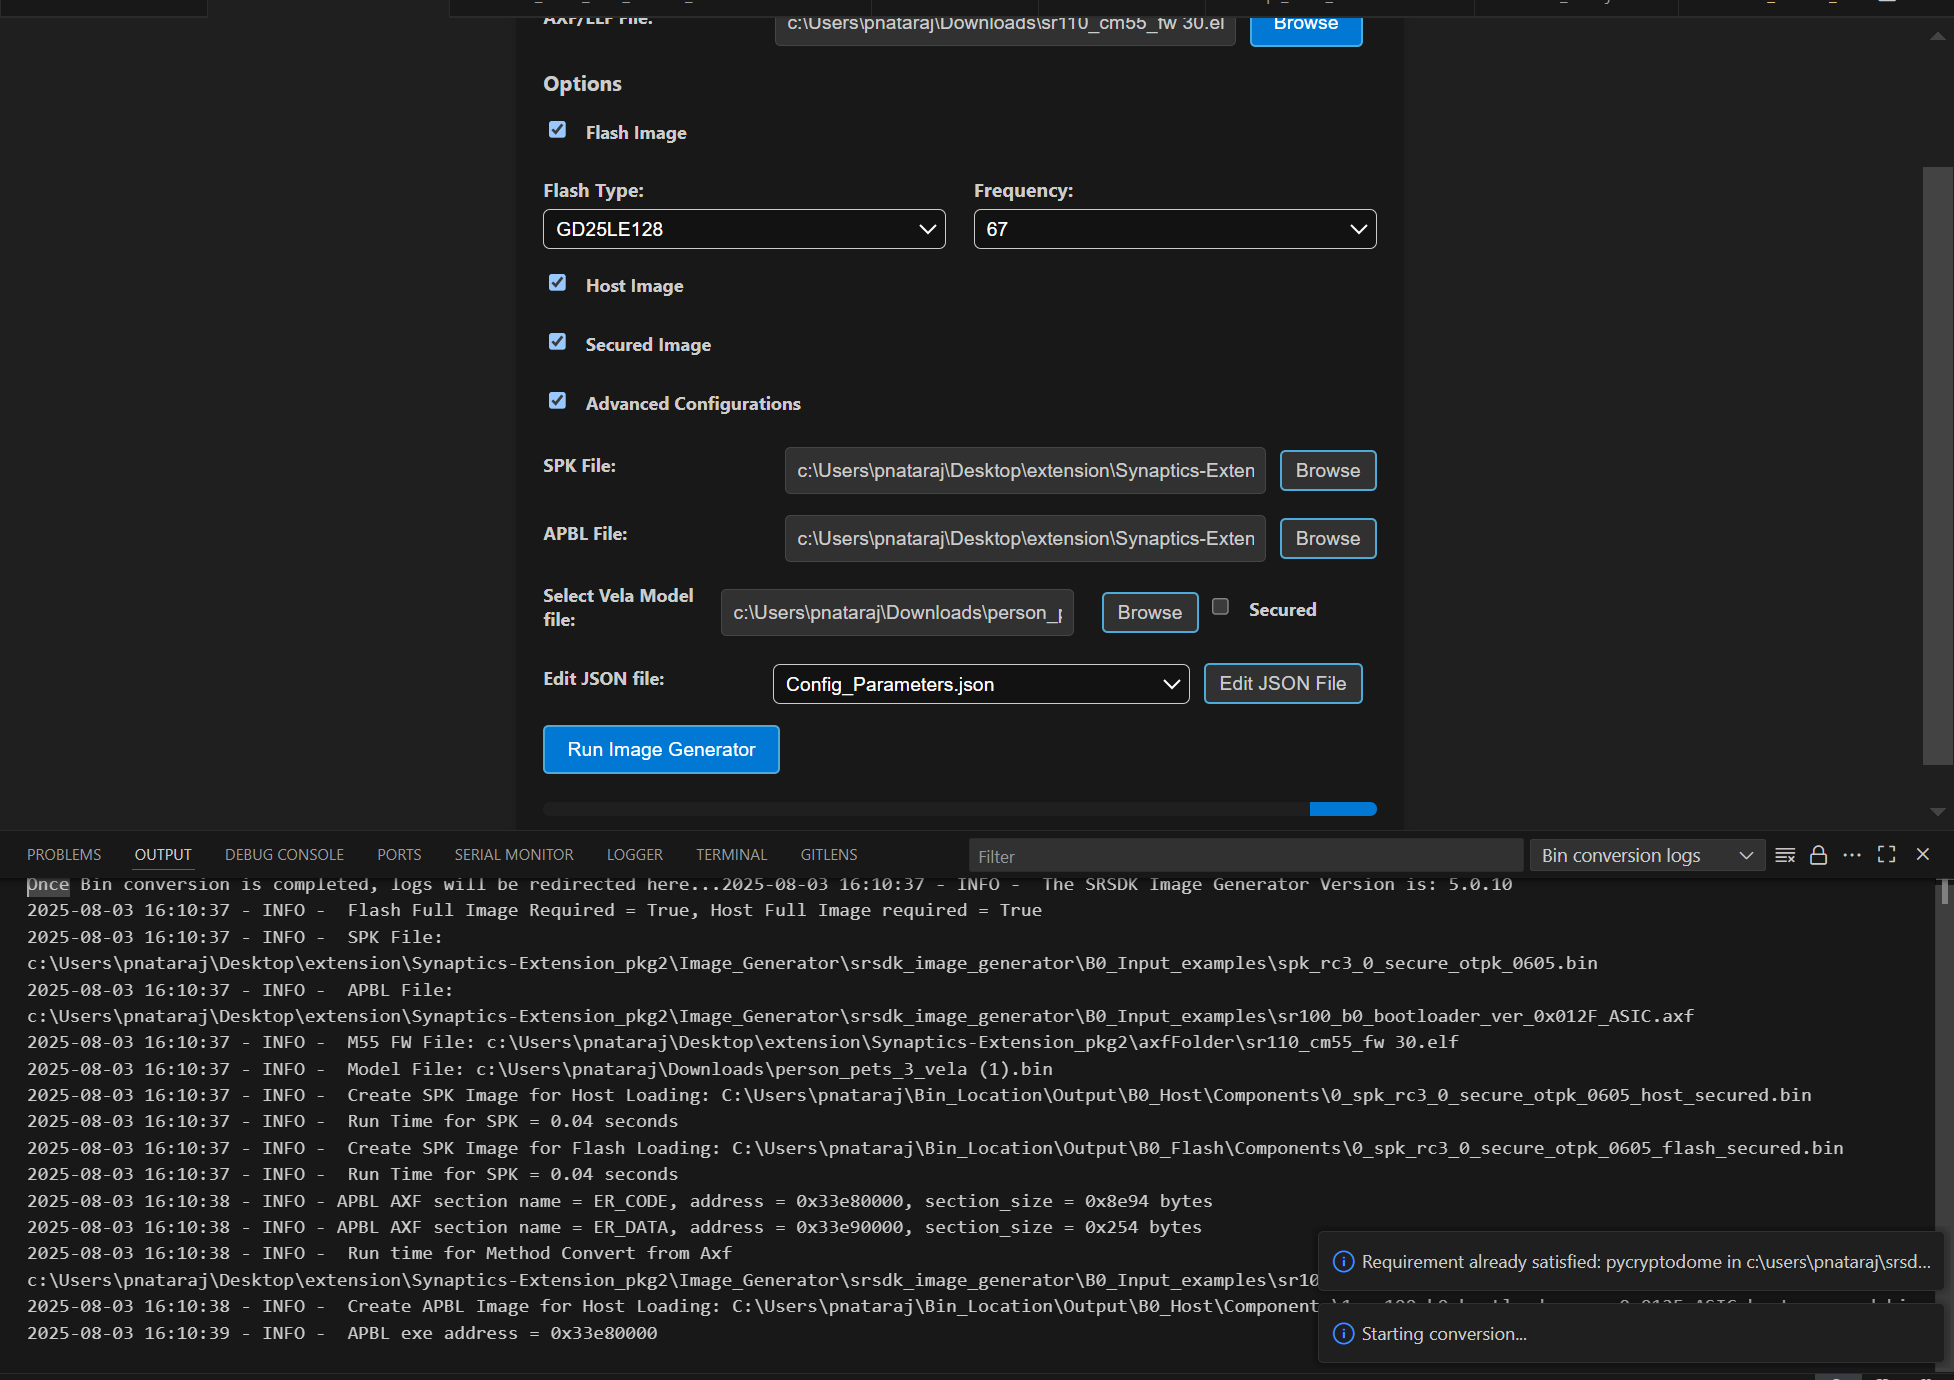
Figure Image Conversion - Advanced Configurations
Result:
- The converted bin file path will be populated to Image Flashing
Webview.
- Once the conversion is completed, the conversion logs and binary
files will be present in the following location C:Users<username>Bin_Location for Windows and in home/<username>/Bin_Location for Linux and macOS.
NOTE:
The above steps — tool installation, SDK build, and BIN conversion — can be performed in an SSH remote setup or WSL environment. Further steps beyond this (Image flashing, debugging and Video Streamer) are not supported in remote setup.
After selecting the required options, click the Run Image Generator button to start the image generation process inside the Docker container. Live logs will be displayed in the terminal.
Image Flashing
Purpose: The image flashing web view can be used to load the image onto the device either in ROM mode or FW mode
Figure Image Flashing
Pre-requisites:
Install Python and necessary packages using the “SRSDK Tools Installer” tab to ensure proper working of flashing.
Ensure that the UART and the target device are properly connected to the system prior to starting flashing.
Flashing the image in ROM/FW mode
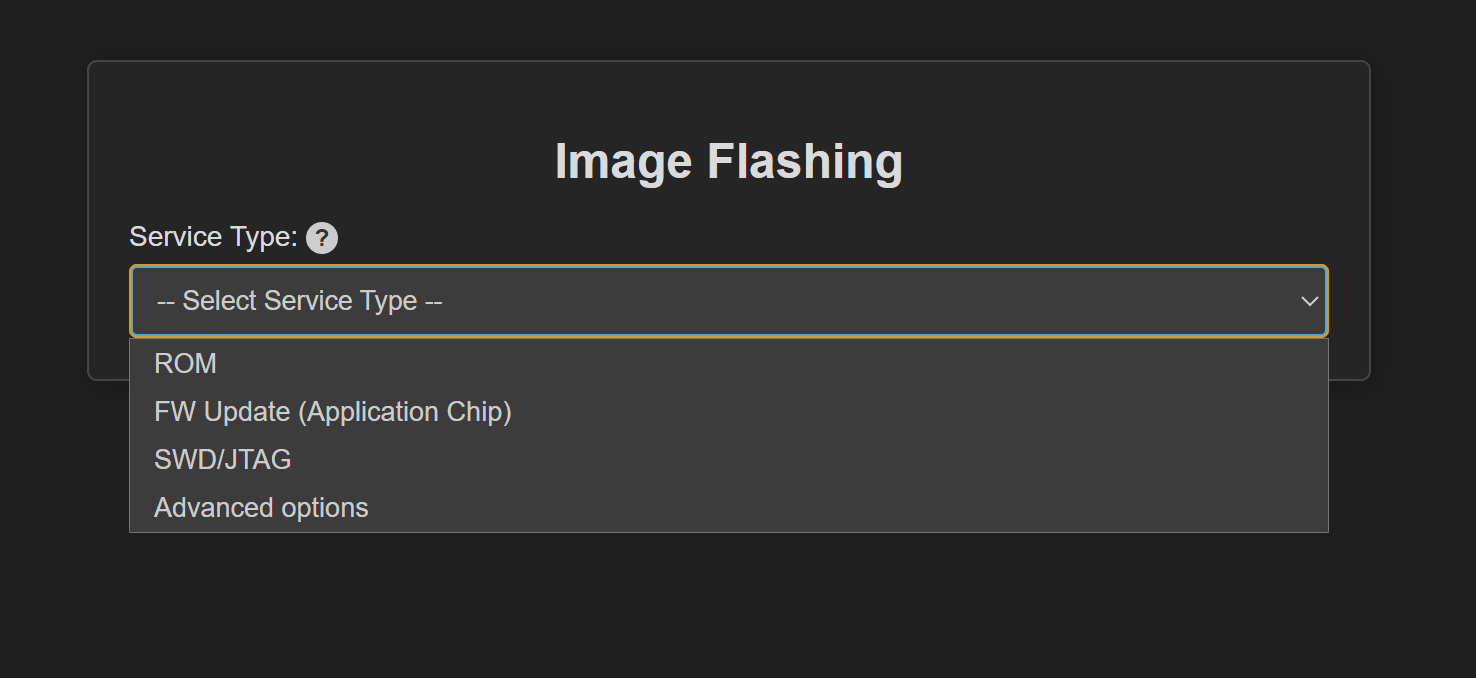
Figure Image Flashing - Service Type
Steps:
Make sure the device connections are properly established.
To load the binary into the RAM (using UART connection), select Service type as “ROM” and Select Command as “Load an Image from Binary File”.
To flash the image into Flash memory (using UART connection), select Service type as “ROM” and Select Command as “Burn File to Flash”.
To flash the image into Flash memory using CDC (FW update – application chip), select Service type as “FW” and Select Command as “Burn File to Flash”.
To update the DAP firmware, select “Advanced Options” → FW Update (Debug IC) in Service Type, choose the DAP chip COM port, and click Proceed in the confirmation dialog to flash the DAP-built binary to the Debug IC.
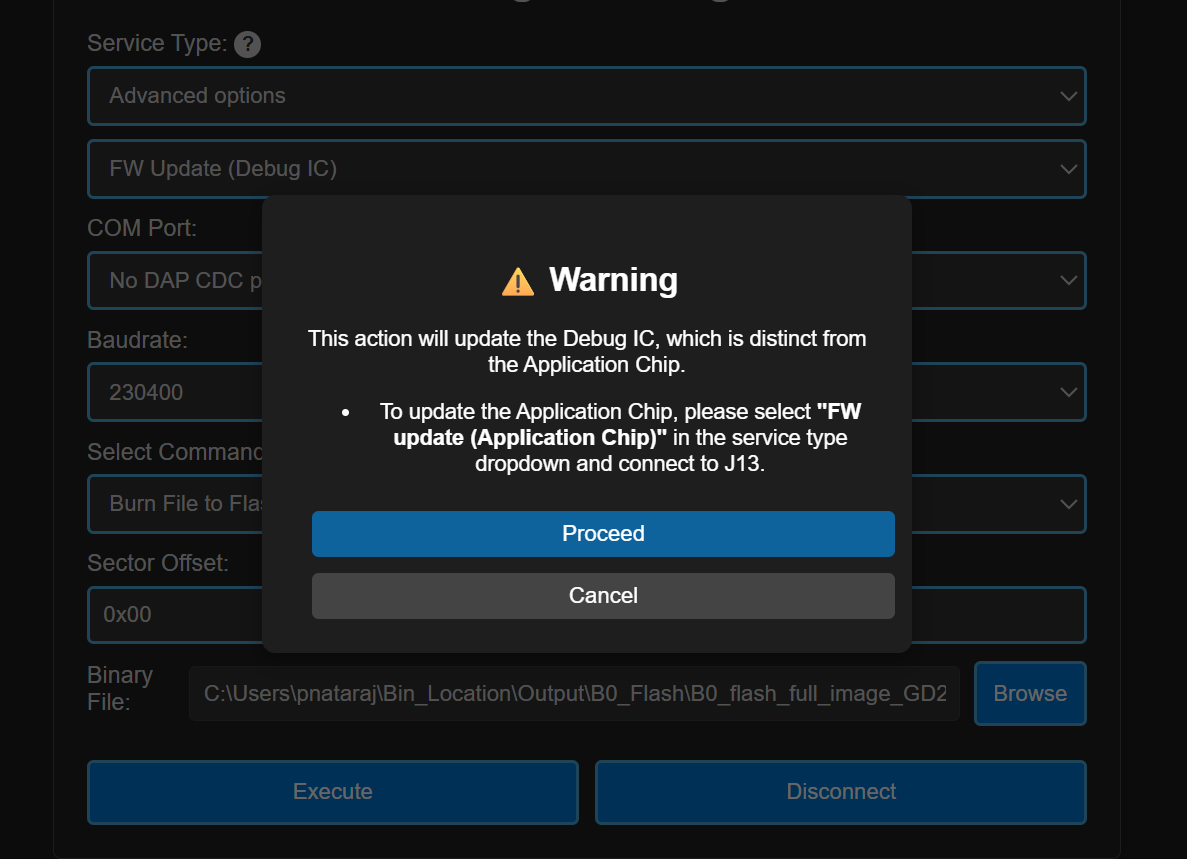
Figure FW Update (Debug IC) - Warning pop up
The connected COM ports will be listed under the “COM Port” dropdown.
Note (Linux):
UART devices connected via USB will appear as /dev/ttyUSB0, /dev/ttyUSB1 etc. Use these for flashing in ROM mode (UART-to-USB connection).
The available CDC will appear as /dev/ttyACM0, /dev/ttyACM1 etc. Use these for flashing in FW mode (FW update).
Note (macOS):
UART devices connected via USB will appear as /dev/cu.usbserial-xxxx (e.g., /dev/cu.usbserial-DQ015QCI). Use these for flashing in ROM mode (UART-to-USB connection).
The available CDC will appear as as /dev/cu.usbmodemxx_xx (e.g., /dev/cu.usbmodem01_00_00_001). Use these for flashing in FW mode (FW update).
Select the appropriate Baudrate.
The binary file path will be already populated either as dropdown (if both Host and Flash images were converted) or as file path text box (if either Host or Flash alone is converted). If user wants to select a custom file for flashing, they can choose the binary file path using the “Browse” button.
While flashing the model binary file, please enter the sector offset address from which the model should start flashing at.
Click on “Execute”, the image loading will start, and the logs will be redirected in the output console.
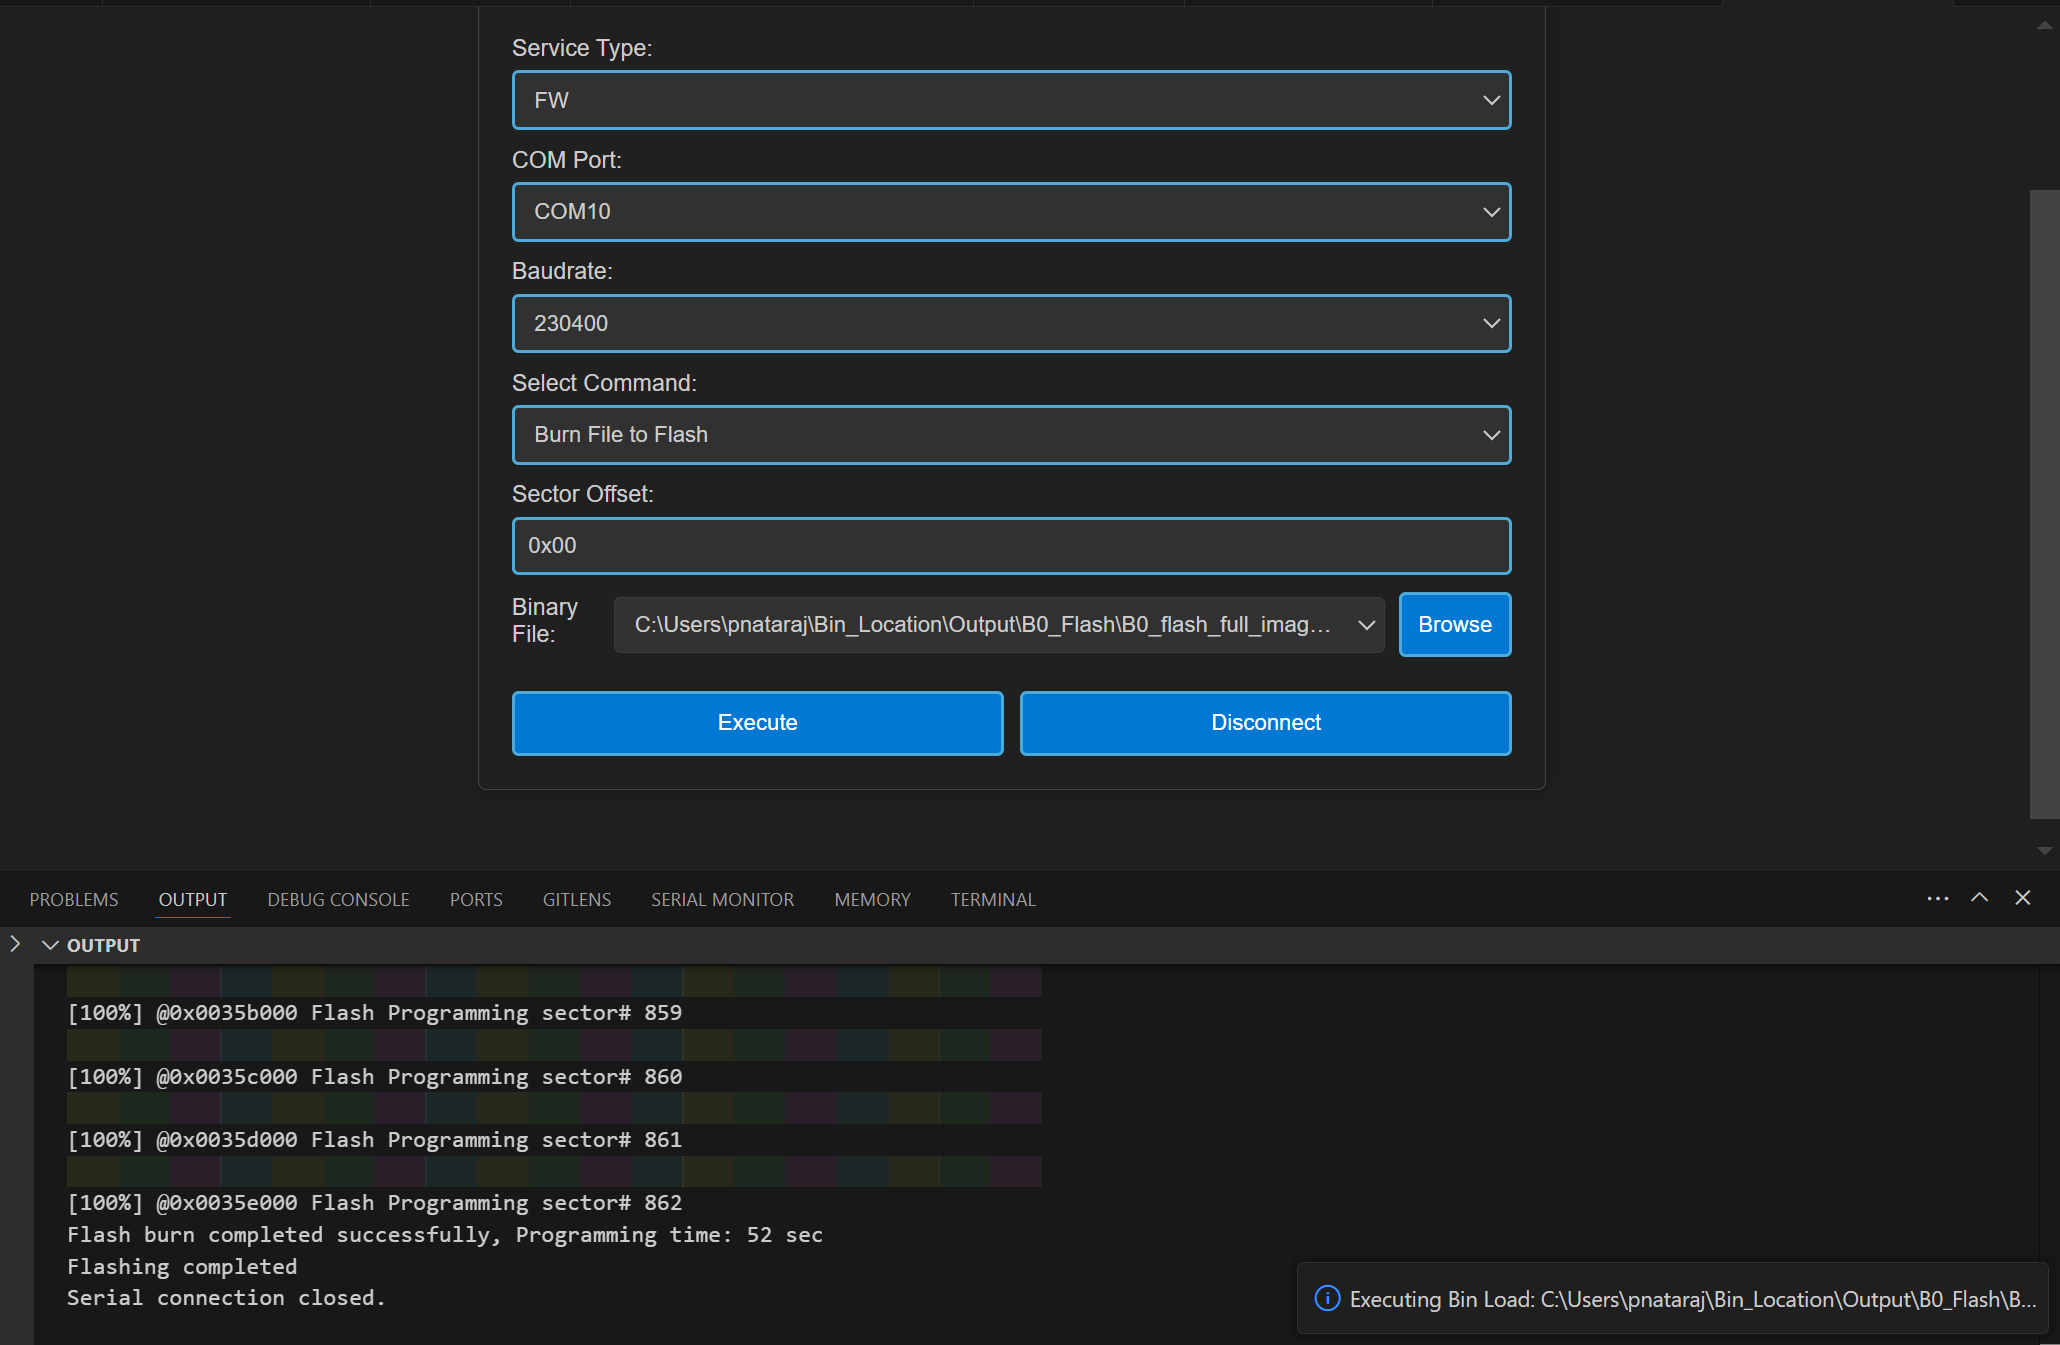
Figure Image Flashing logs redirected to Output
Result: After flashing, the COM port will be disconnected, and the new CDC will be detected. Logs of the loaded use case can be visualized using the Serial Monitor tab. Select the appropriate COM port and click “Start Monitoring”.
Flashing image using SWD/JTAG
Purpose: This window allows users to flash the binary on to the device using JLink/DAP.
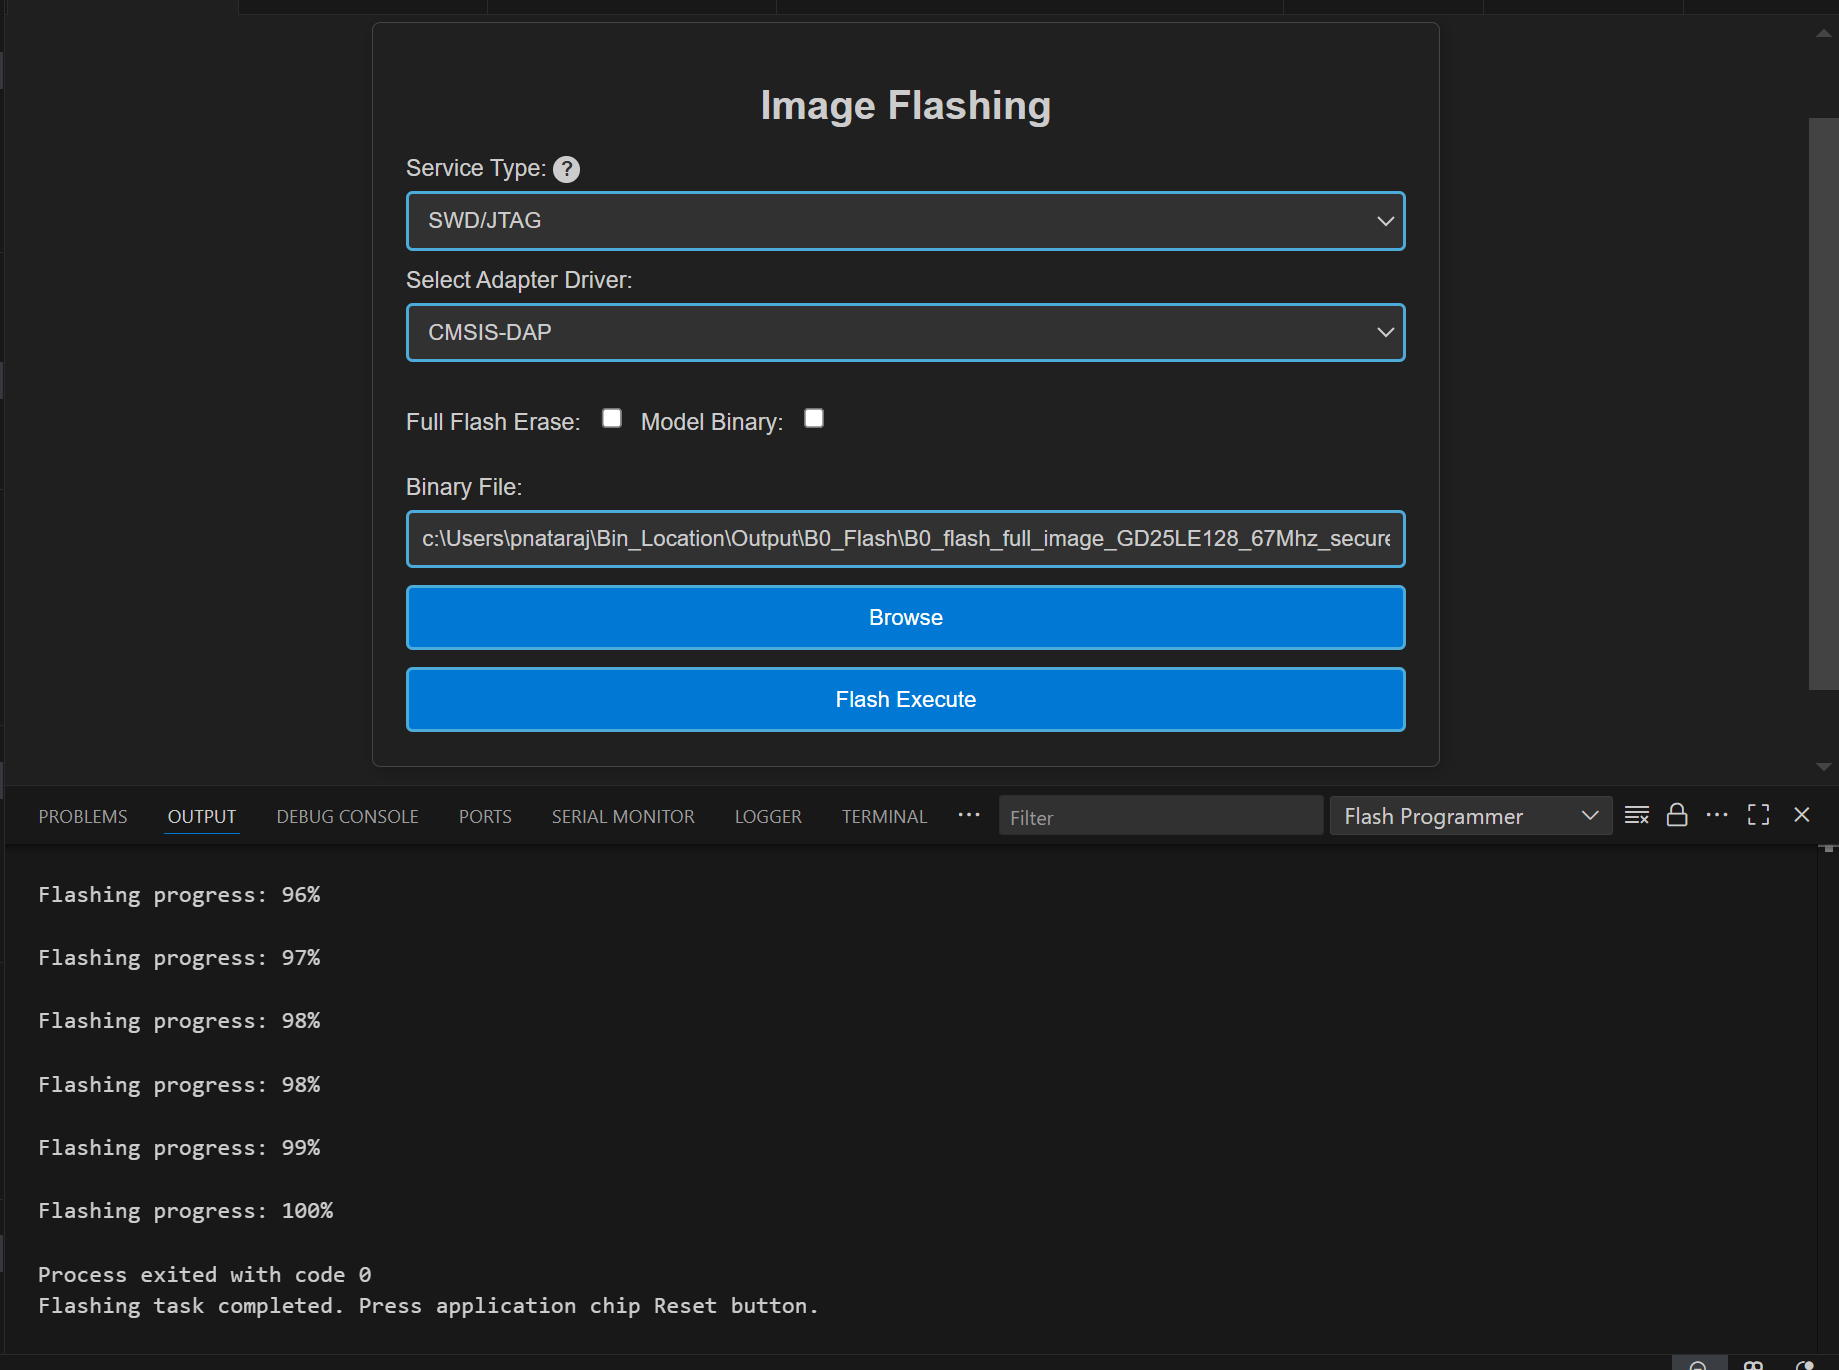
Figure Image Flashing using SWD/JTAG
Steps:
Select Service Type as “SWD/JTAG” in the Image Flashing Webview.
Select the Adapter Driver.
The flash binary file path will be pre-populated (if already flash binary is converted) or users can select the custom binary file using the “Browse” button.
When updating the use case, choose “Full Flash Erase” and click “Flash Execute” to erase the entire flash, ensuring a clean binary update.
After performing a full flash erase, deselect the checkbox and click “Flash Execute”. This will launch OpenOCD and GDB in separate terminals, establish a connection, erase the necessary memory, and flash the binary. Progress and script logs will appear in the Output window, while flashing logs will be shown in the OpenOCD terminal.
Result: Once flashing is completed, the telnet connection will be dropped. Press reset on the device.
Steps to flash model binary using SWD/JTAG:
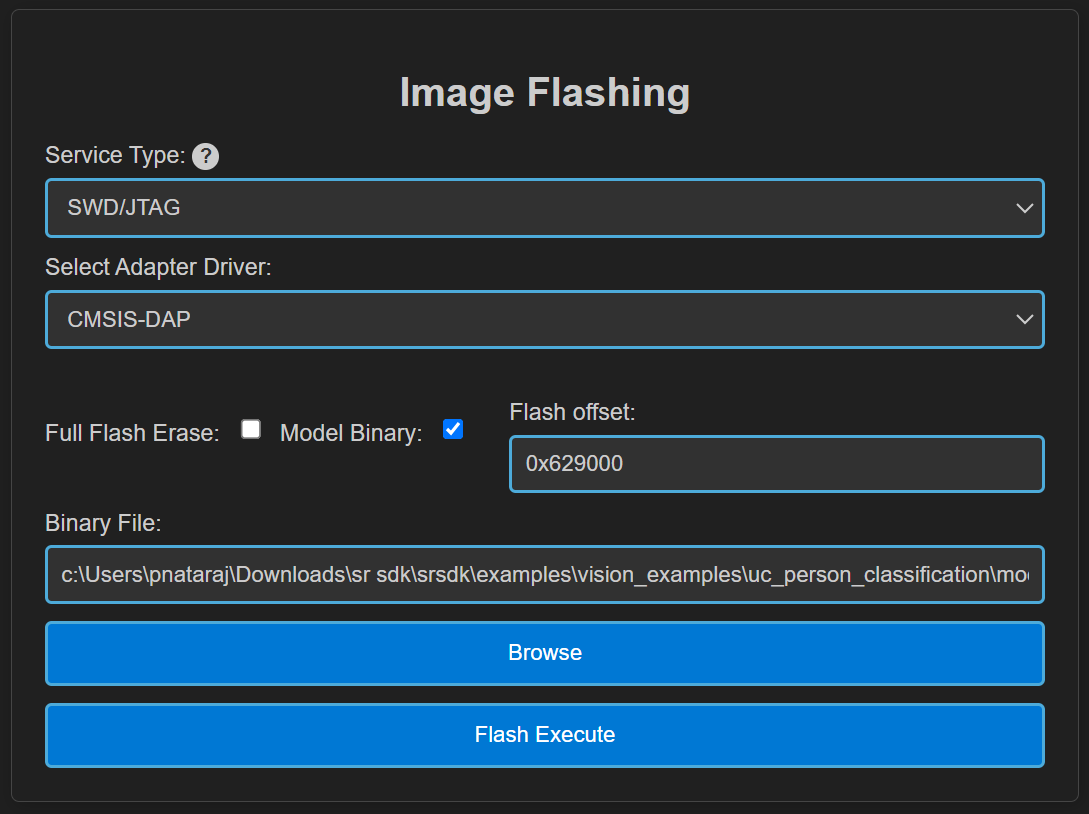
Figure Model binary flashing using DAP
Do full flash erase - select the “Full flash erase” checkbox and click Flash execute to perform a complete flash erase.
Load the usecase vga binary file.
Load the model binary file - Select the “Model Binary” checkbox. A text box will appear to enter the flash offset—enter 0x629000. Browse and select the model binary, then click Flash Execute.
After flashing both usecase and model bins, click application chip reset. CDC will be detected.
Notes:
Users can load the use case binary independently or update the model binary (for the same use case).
However, if plan to change both the usecase and model bins, it’s recommended to perform a full flash erase beforehand.
If the CDC is not detected after flashing, try performing a full flash erase and reloading the binaries.
Since the binaries are flashed using OpenOCD commands, a sector erase is performed for the binary size before flashing. As a result, the flashing process takes a bit more time.
Debugging using GDB in Extension
Purpose: This feature enables the user to debug the Astra SRSDK using OpenOCD and GDB at the backend, aided by C/C++ extension to start the debug session.
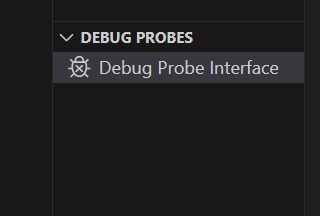
Figure Debug Probe Interface
Download and Reset Program
Pre-requisites:
Install the following extensions using the “SRSDK Tools Installer” tab.
C/C++ IntelliSense, debugging, and code browsing extension in VS Code.
MemoryView extension to view the memory map while debugging.
Serial Monitor extension for viewing logs while debugging.
Memory Inspector CDT extension by Eclipse IDE.
Import an Astra SRSDK before debugging.
Ensure that Debug probe and the target device are properly connected to the system prior to starting debug.
Steps:
Click on the “Debug Probe Interface” button in DEBUG PROBES view. This will open the debugger Webview.

Figure Debug Probe Interface Webview
After the Debug Probe Interface opens, use the browse button to select the path to the axf/elf file. Ensure that the file chosen is built with the ‘debug’ build type. If debug axf/elf was already built successfully using the extension, the file path will be automatically populated to the AXF/ELF Filepath.
- Select the necessary configurations (use the default configs: Transport select – SWD, Adapter Driver – JLink/CMSIS DAP, Adapter speed – 1000 KHz).Note: Adapter speed adjustment is supported with J-Link during debugging, but not yet fully functional with DAP.
- Users can either opt to use the default config file or can use custom config file for debugging. Select the appropriate options in the dropdown.Note: The default config files are available at <parent directory>/tools/openocd/configs/ folder for reference.
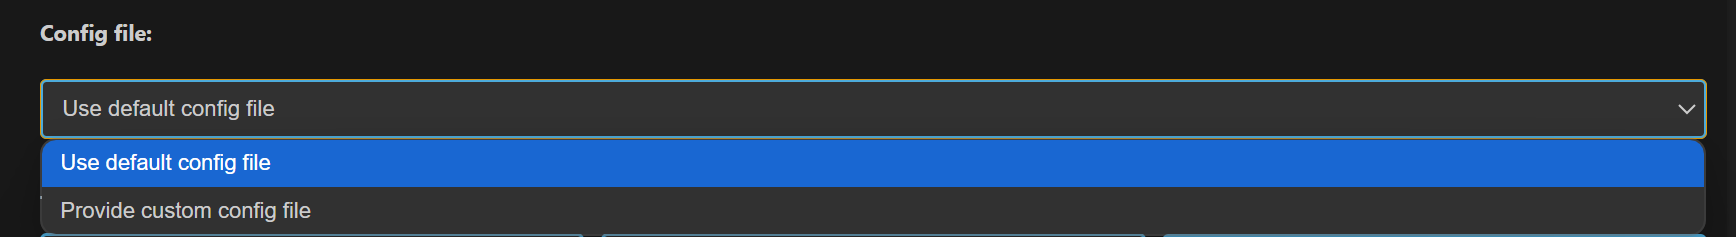
Figure Config File Selection
- After selecting the configs, hit “Download & Reset Program” button, you can see the status in the terminal window. This will start running OpenOCD in one terminal and start GDB debug session in another terminal.Note: If debugging fails to start and you see messages like “Unable to start debugging,” try resetting the DAP chip and attempt again.
Once connection is established, the debugger will stop at main.
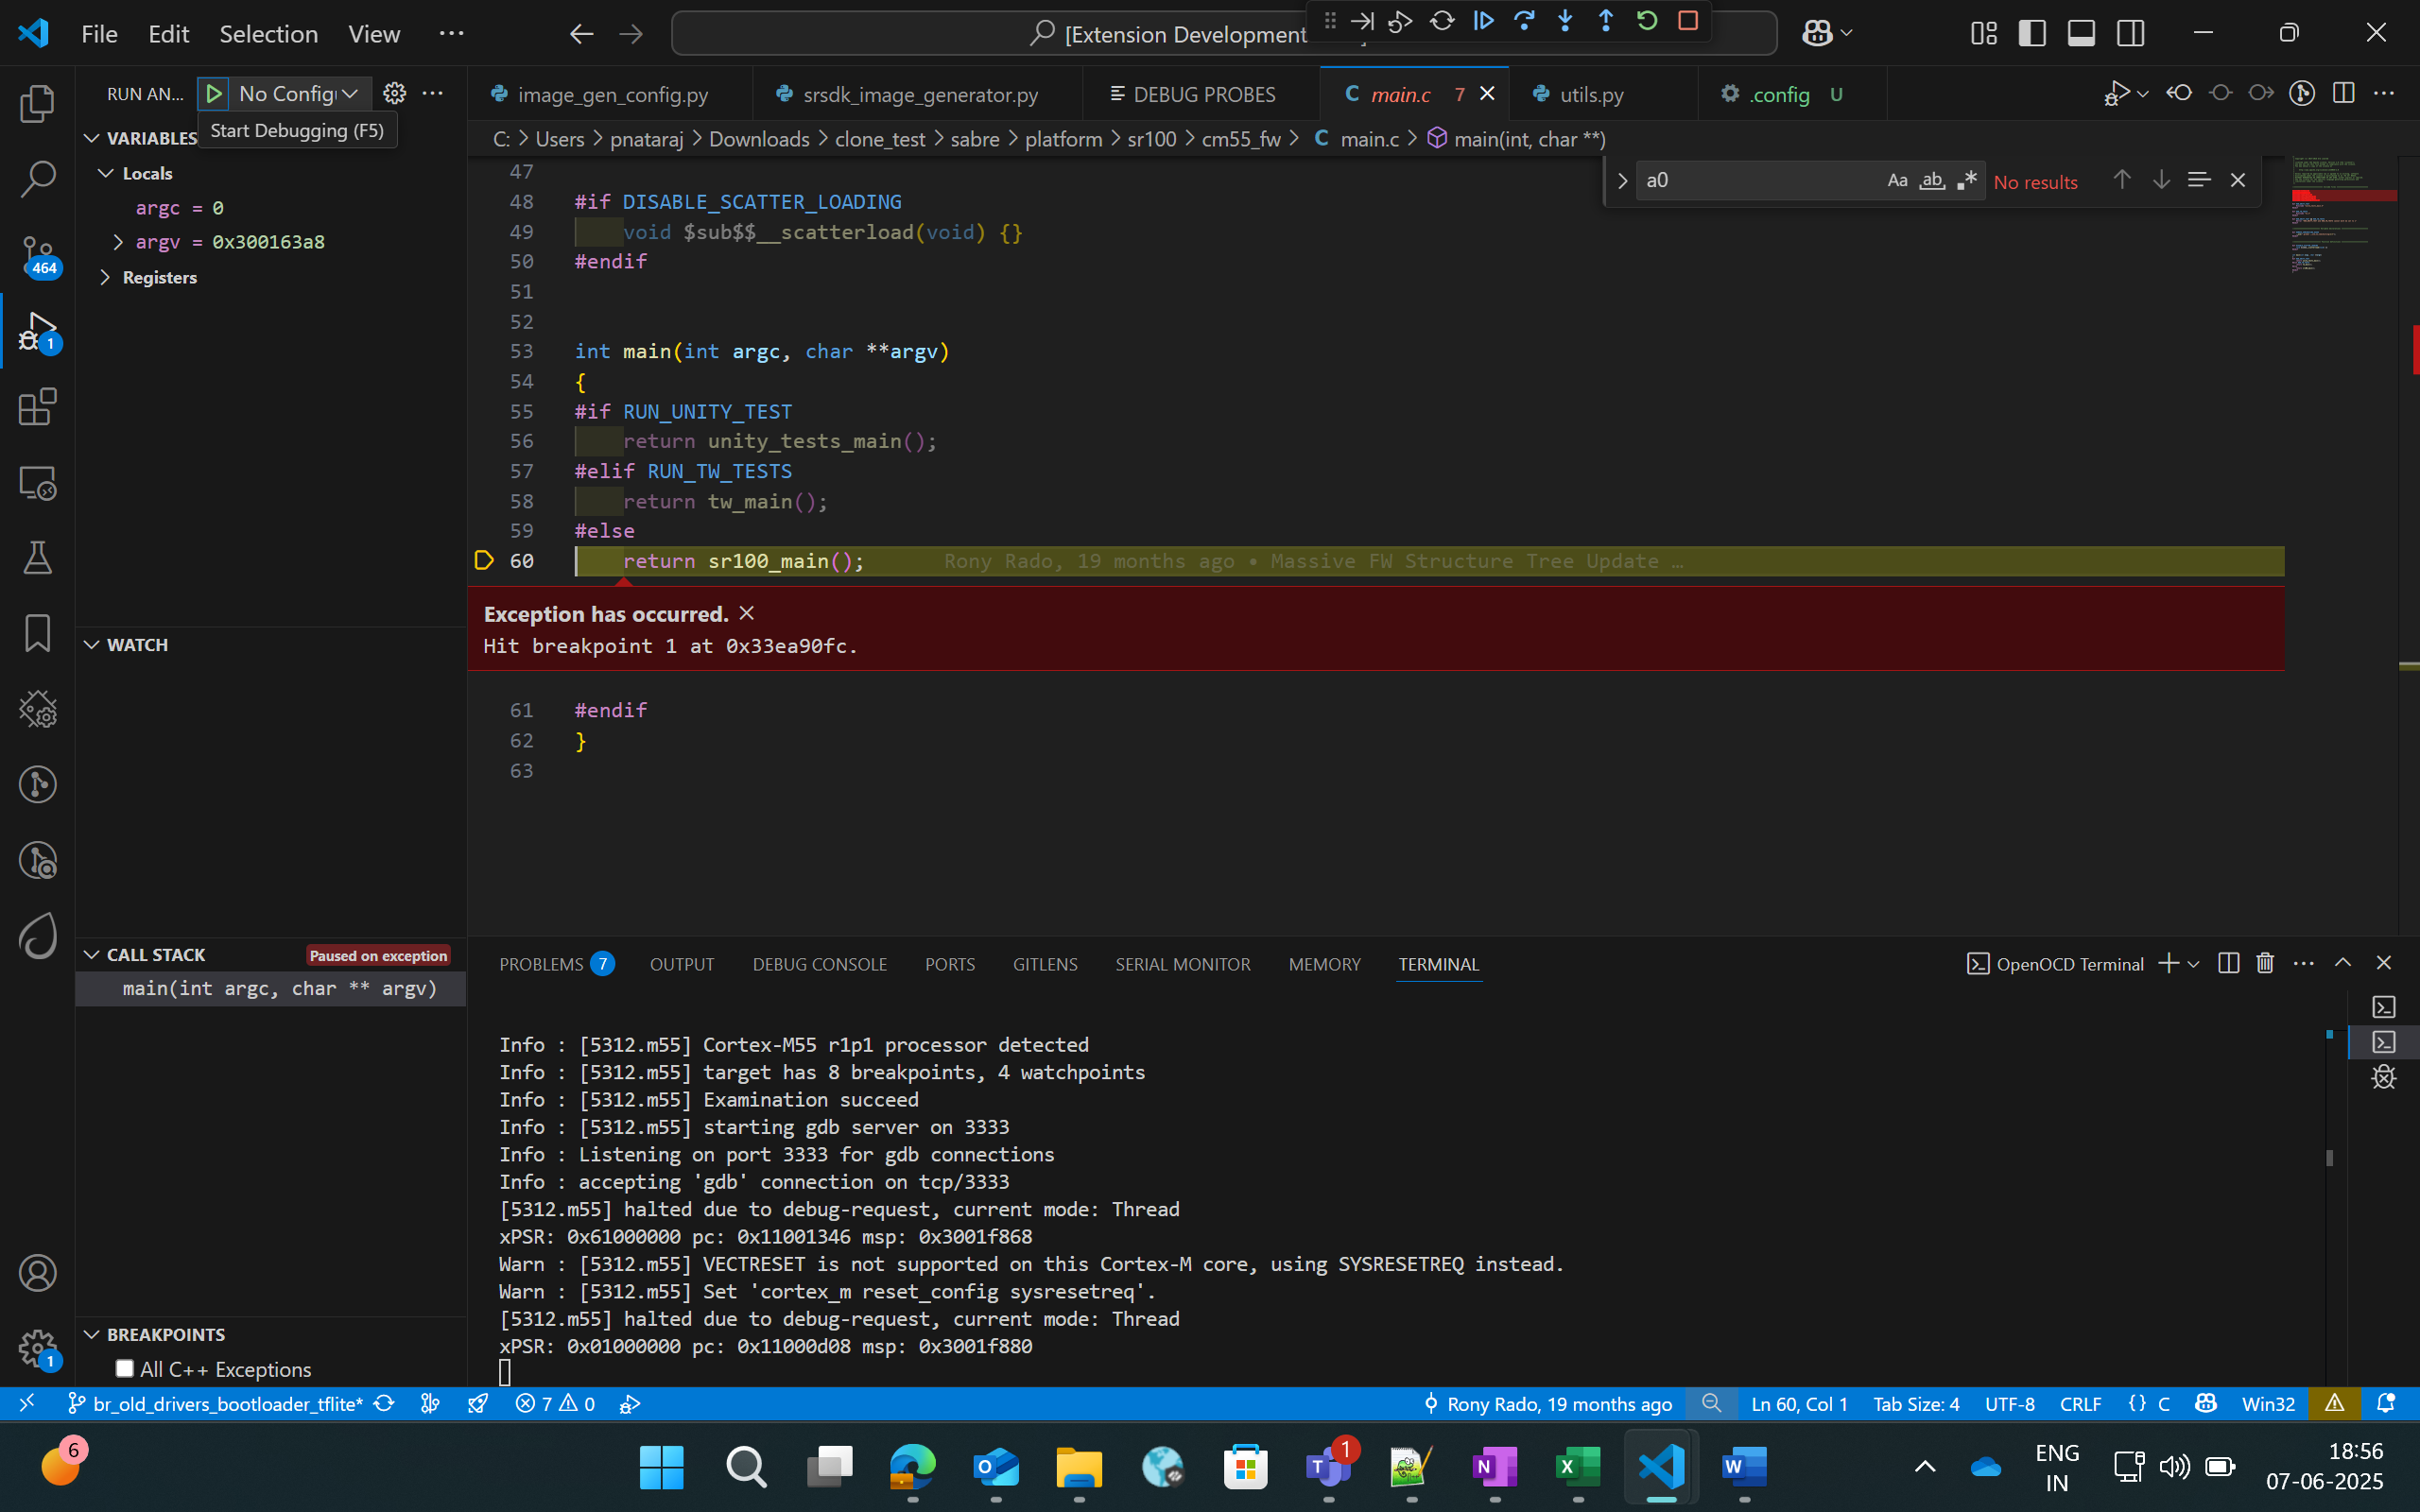
Figure Debugger paused at main
- Once the debugger is paused, users can view the variables, call stack, registers and the breakpoints in the side panel as shown in the below picture.
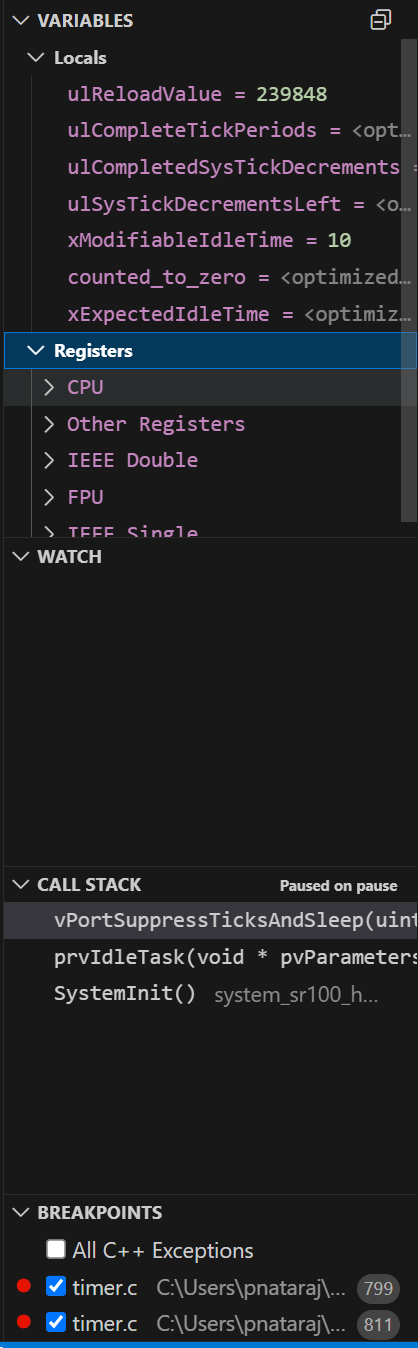
Figure Debugger - Side panel options
Global Variables
Purpose: Since the C/C++ extension used to start the GDB session doesn’t support populating Global variables as they show the Local variables, users can view a list of Global Variables along with its values using this feature.
Steps:
While a debug session is active, right-click on the code space to view more options, click on “Show Global Variables”.
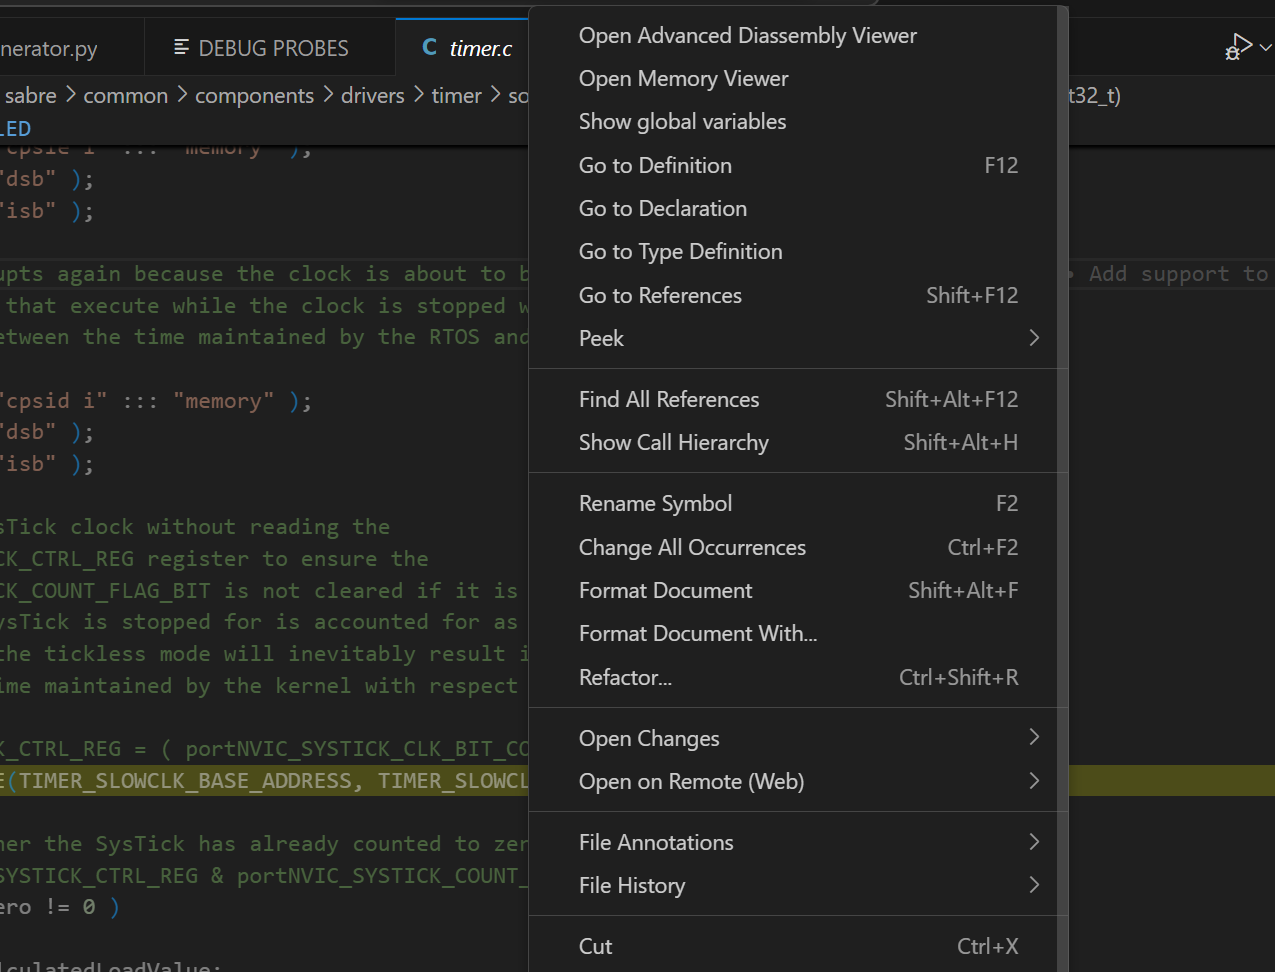
Figure Show Global Variables button
This will open a side panel which will list all the Global variables, their address, type and respective values. When this panel is open, it will get refreshed to fetch the latest values whenever the debugger is paused, either manually or while hitting a breakpoint.
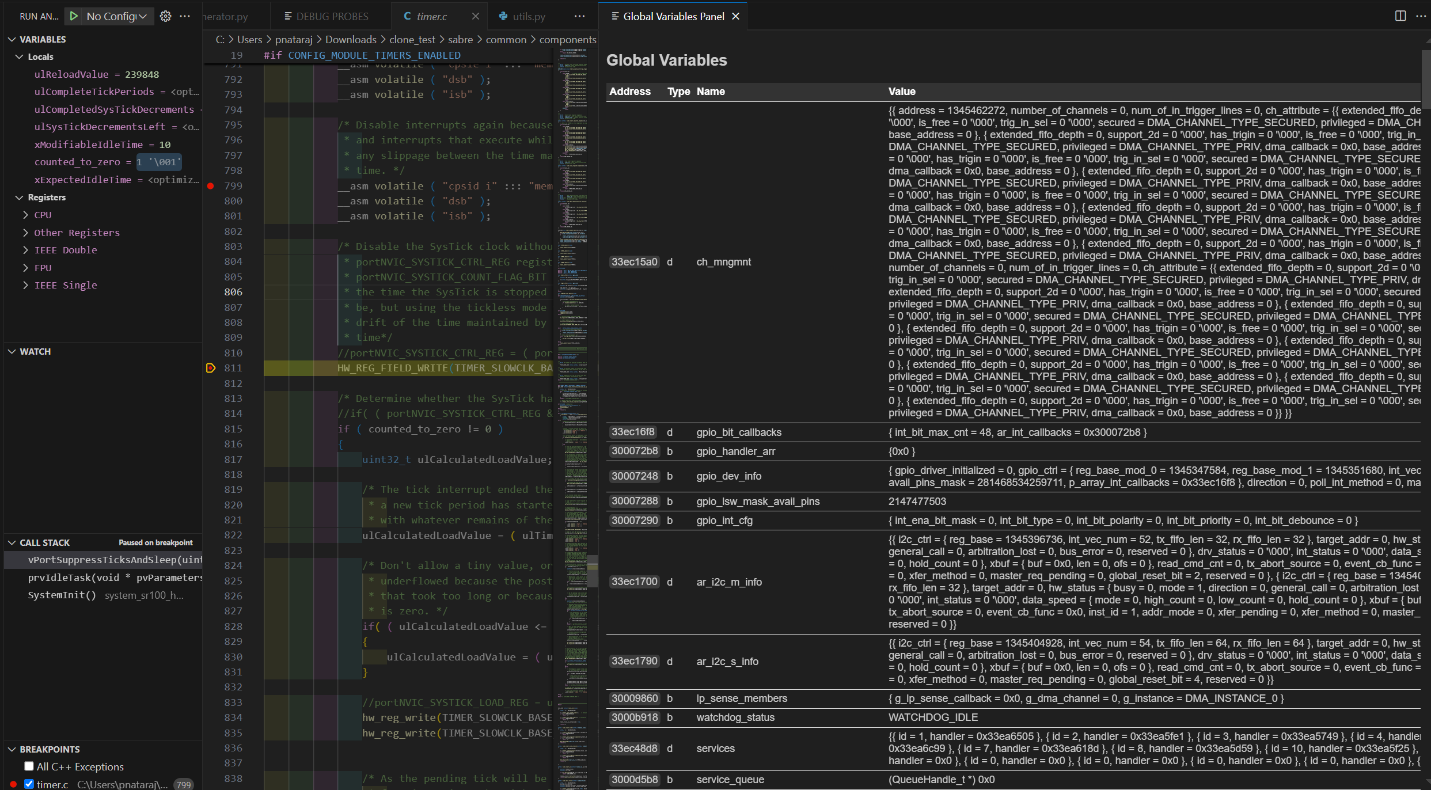
Figure Global Variables Panel
Debug Toolbar
Once a debug session is started, the debug toolbar will appear at the top of the window and will contain the buttons for basic debug operations.
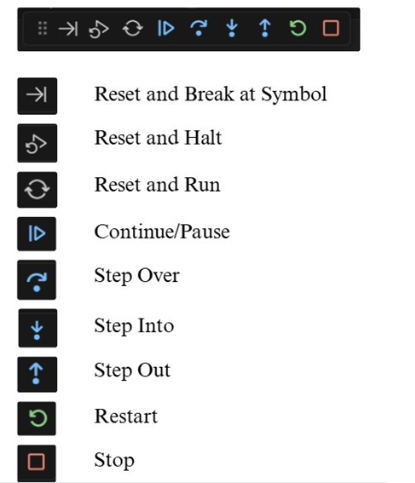
Figure Debug Toolbar
Reset Options:
Option |
Description |
|---|---|
Reset and Break at Symbol |
Used during debugging when user needs to reset the program and pause execution at a particular symbol. The user can enter the desired symbol in the text box (refer Figure 48), press enter and then click the Reset and Break at Symbol icon. |
Reset and Halt |
Resets the program, starts a new debug session, and immediately halts execution at Reset_Handler. |
Reset and Run |
Resets the program, starts a new debug session, and runs it without any halts or breaks. |
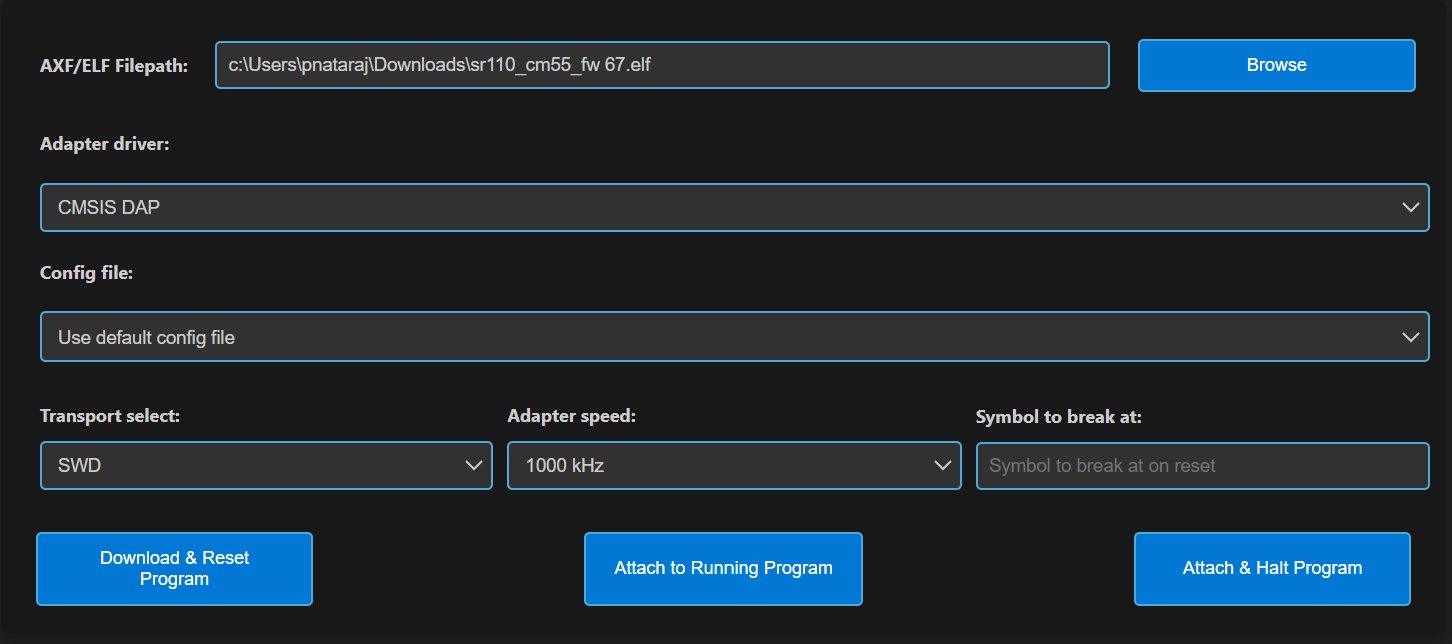
Figure Symbol to Break at option
Other Options:
Continue/Pause - to continue or pause the execution while debugging. In Linux and MAC, as pausing the debug session was not working, users can click on custom pause button added to this panel to pause the execution.
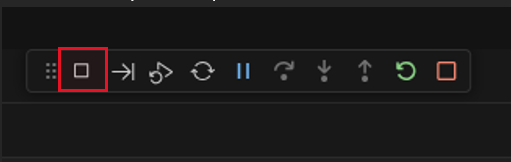
Figure Custom pause button for Linux and MAC
Step Over – executes the current line of code without entering any function calls.
Step Into – Executes the current line and, if a function is called, enters the definition for step-by-step debugging.
Step Out – Continues execution until the current function returns, then pauses at the calling location.
- Restart - To restart the currently running debug session, with
the previously used entry point. For example, if user has started a debug session with ‘X’ as entry point, restart will end the current session and start a new session and stop at same entry point.
Stop – to stop the current debug session.
Memory Inspection and Manipulation
When debugging, users can inspect the raw contents of memory associated with a variable by following these steps:
While debugger is paused, click on the “View Binary Data” button adjacent to the variable.
This action opens a memory view tab which will show the memory contents in hexadecimal bytes, ASCII-decoded text and address offsets.
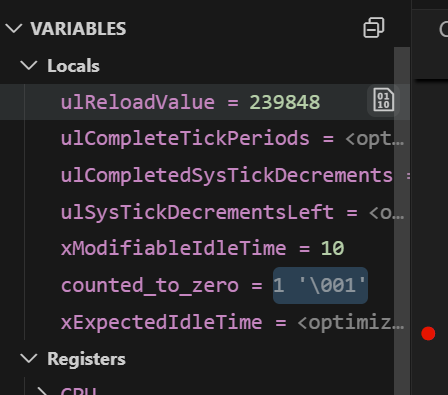
Figure View Binary Data button
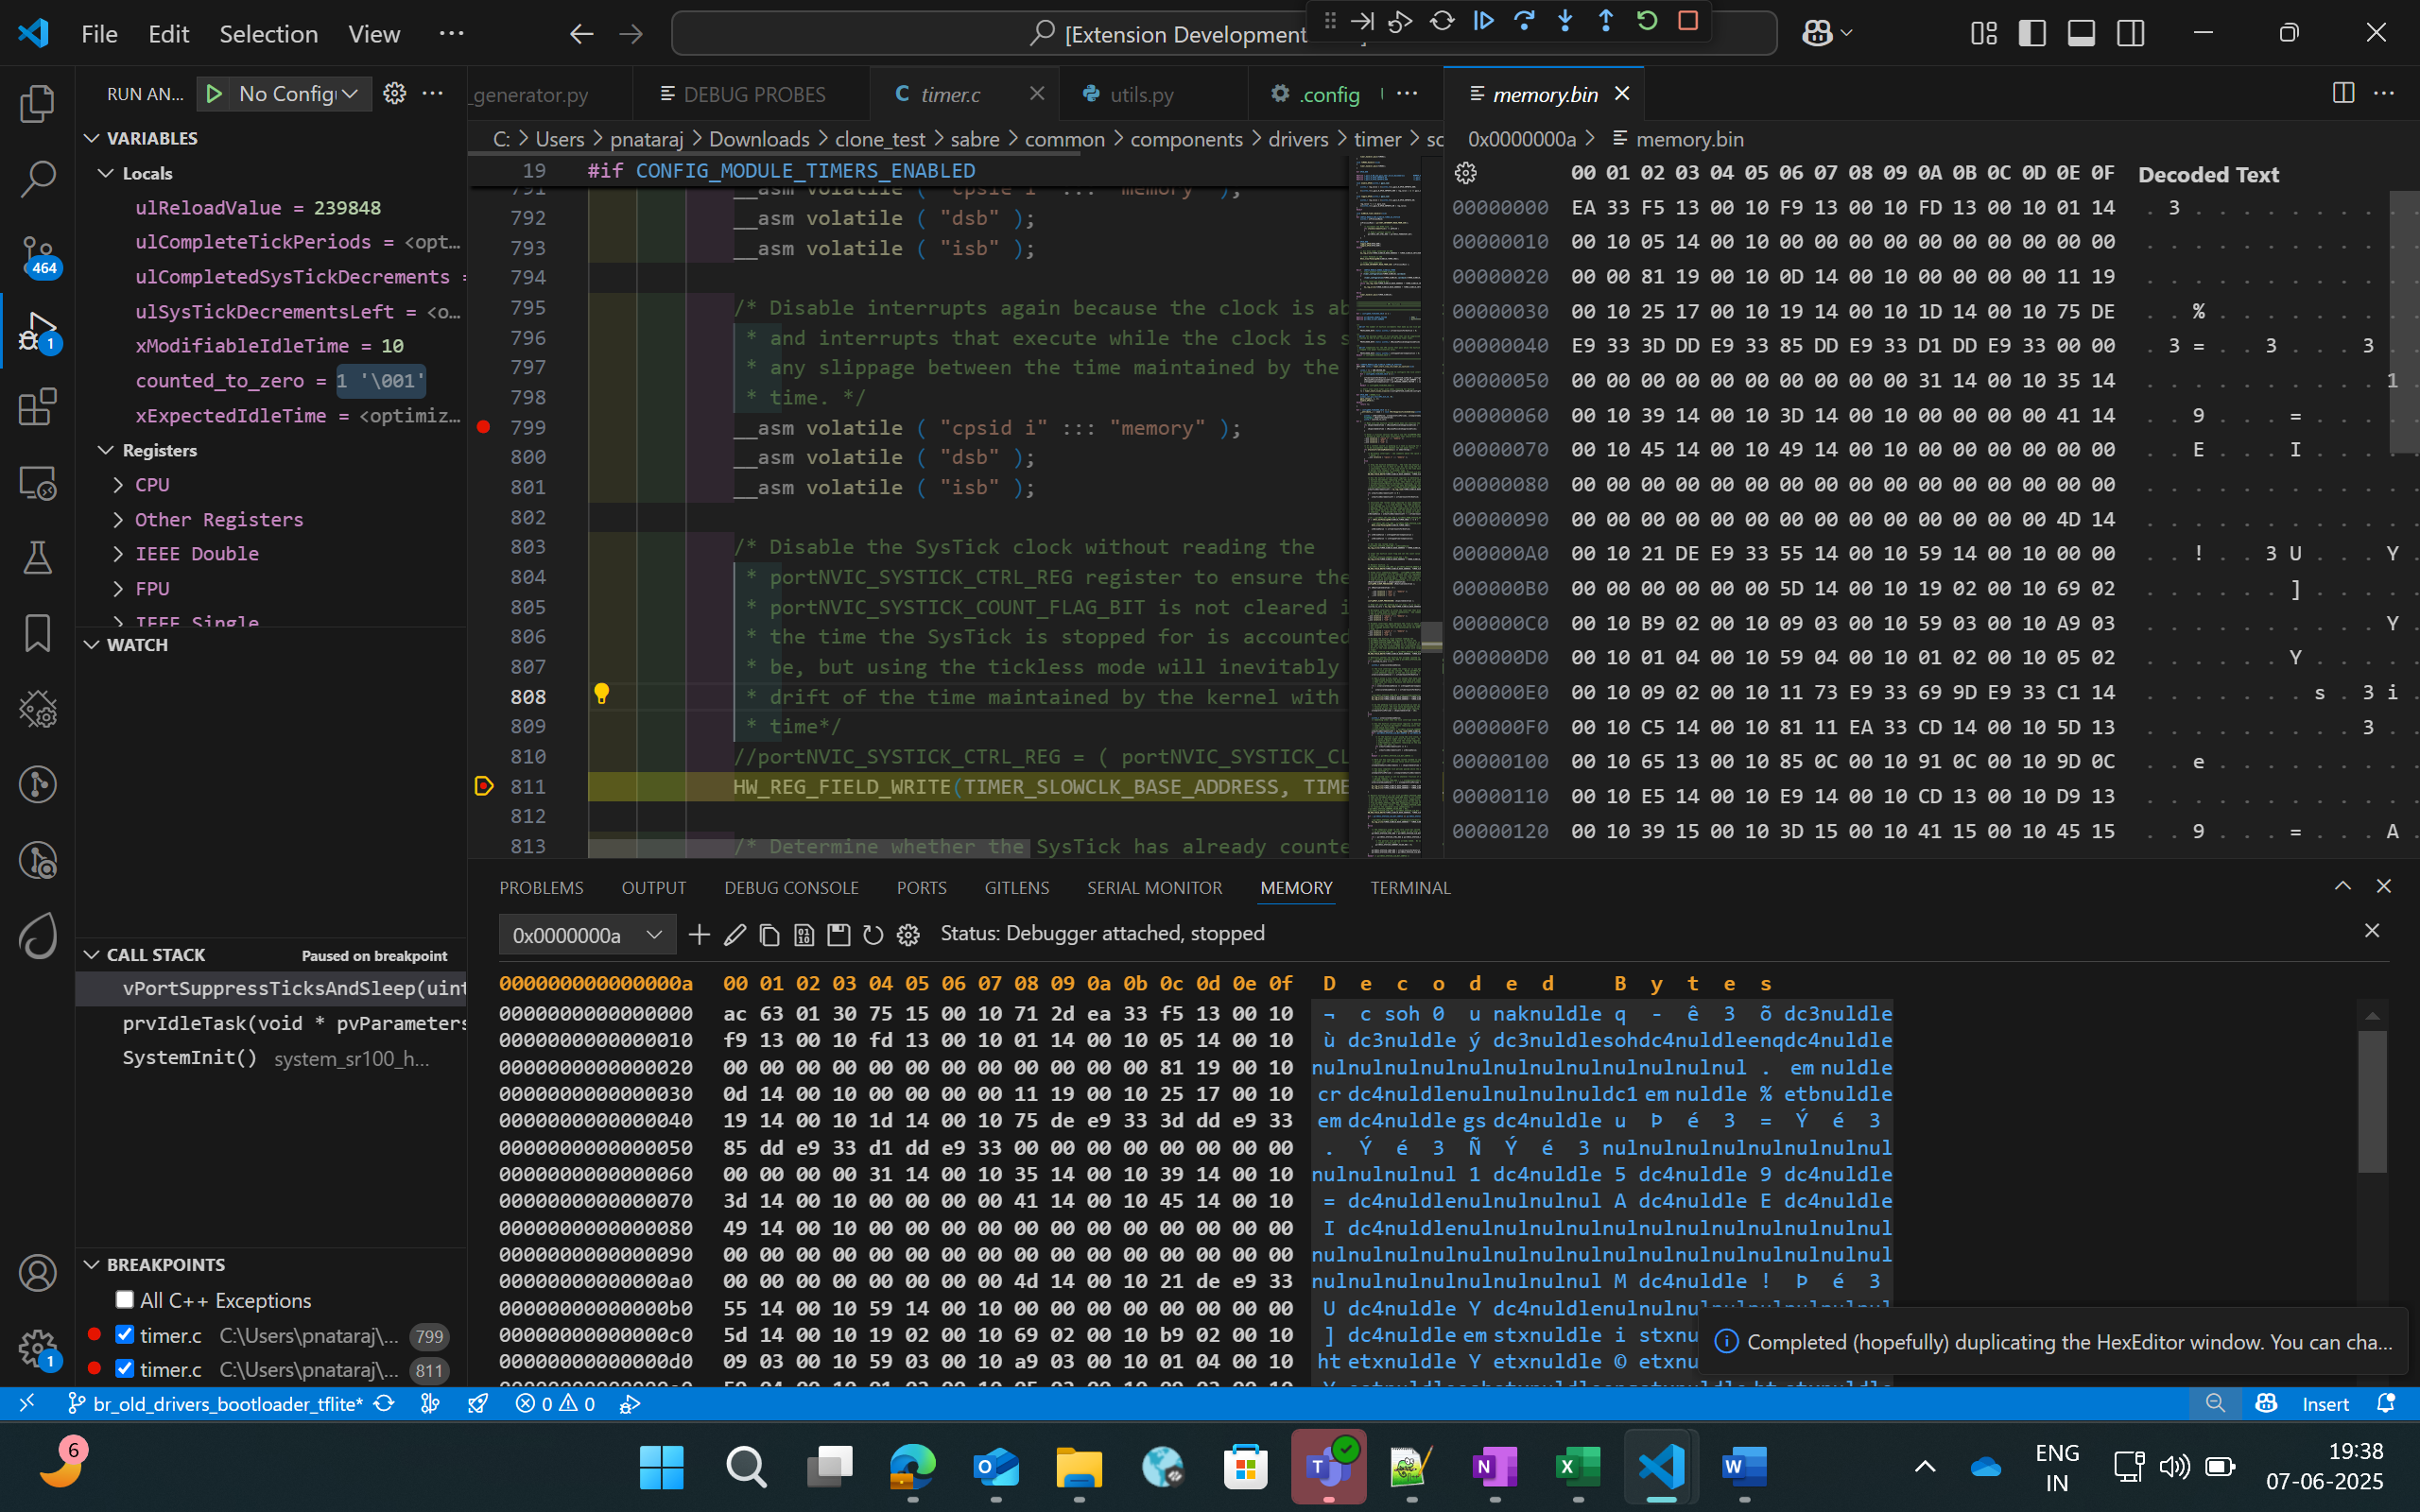
Figure Memory View
To view and edit memory in a particular address, right-click on the code space and select “Open Memory Viewer”. This will open two panels side by side.
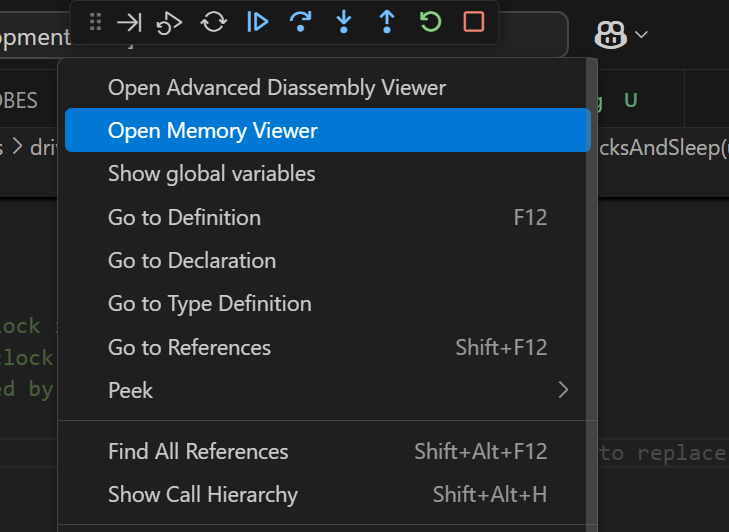
Figure Open Memory Viewer button
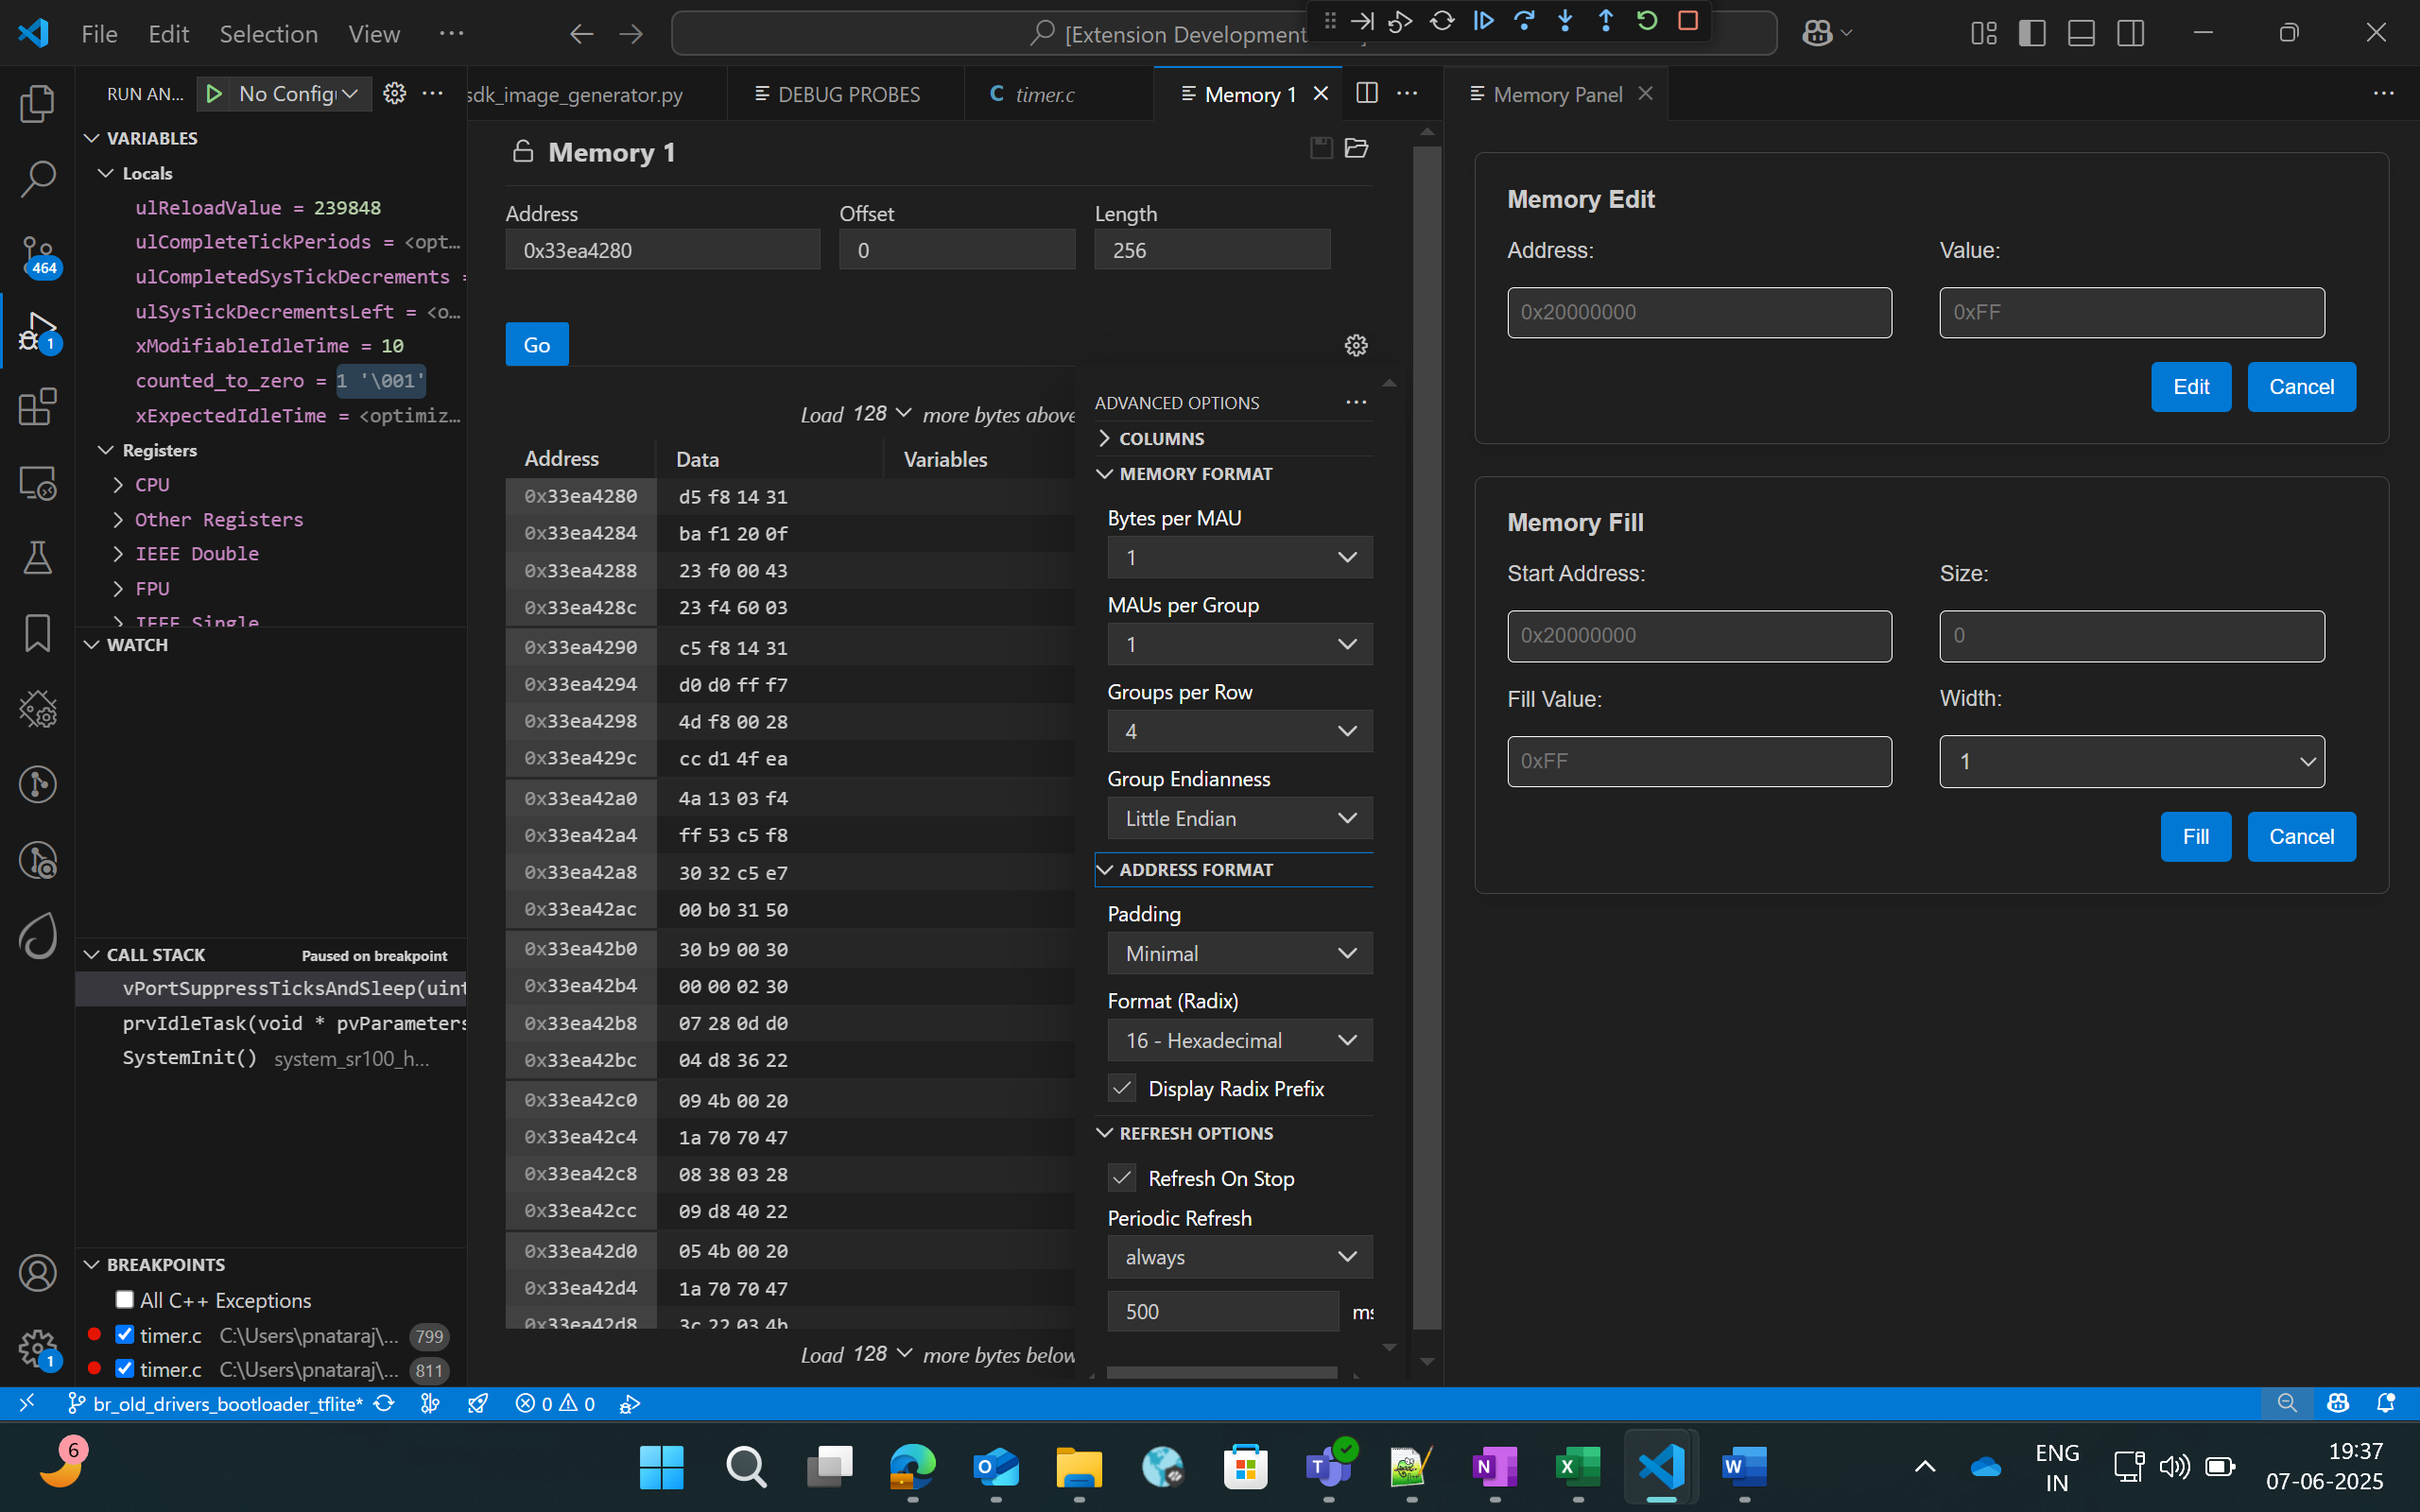
Figure Memory Edit and Fill panel
“Memory” tab on the left side supports the listed features:
Multiple memory formats – hovering over any byte displays multiple representations of the selected byte.
Periodic refresh – When enabled, automatically refreshes memory data.
Configurable memory display – customize memory views with options for columns, grouping and formats.
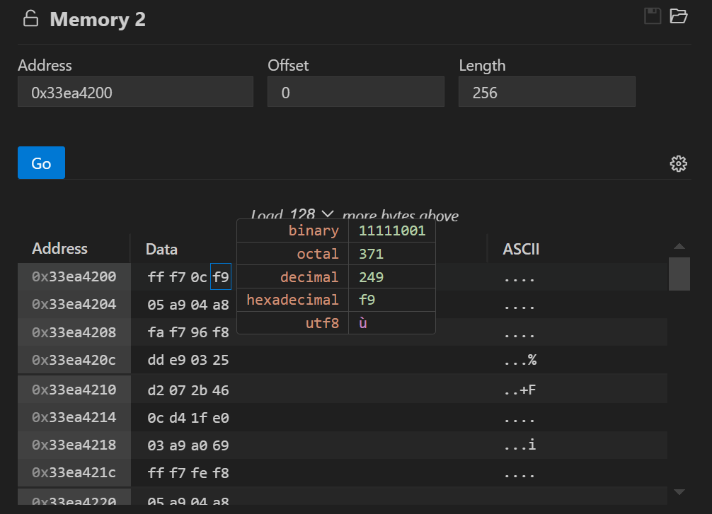
Figure Memory display in multiple formats
Whereas the customized memory panel at the right supports memory editing and memory filling capabilities.
Memory edit – this allows the user to modify a specific memory address.
Enter the target memory address and the byte value to be written, and then click “Edit”.
This will write the specific value to the address. To verify this, users can check by enabling the “Periodic Refresh” option.
Memory Fill – this allows filling a memory block with specific fill value.
Start Address: Beginning address of the memory region to start filling.
Size: Total number of bytes to fill.
Fill value: The value (in hex) to repeatedly write into memory.
Width: Number of bytes written per step (1, 2, 3 or 4).
Note:
Always choose a fill value that fits within the selected width. If it’s smaller, the extension will safely pad it with zeros. For example:
If width is set to 1 byte, you can enter values like 0xFF but values larger than one byte is not allowed.
If the fill value is shorter that the selected width, it will be automatically padded with zeros to match the width. Example: Fill value: 0xFF and Width: 4 bytes, the memory will be filed as: 0x000000FF.
Disassembly Viewer
Purpose: The Disassembly View displays low-level machine instructions alongside their corresponding memory addresses and decode operations.
Steps:
Right-click on the code space and select “Open Advanced Disassembly Viewer” during an active debug session.
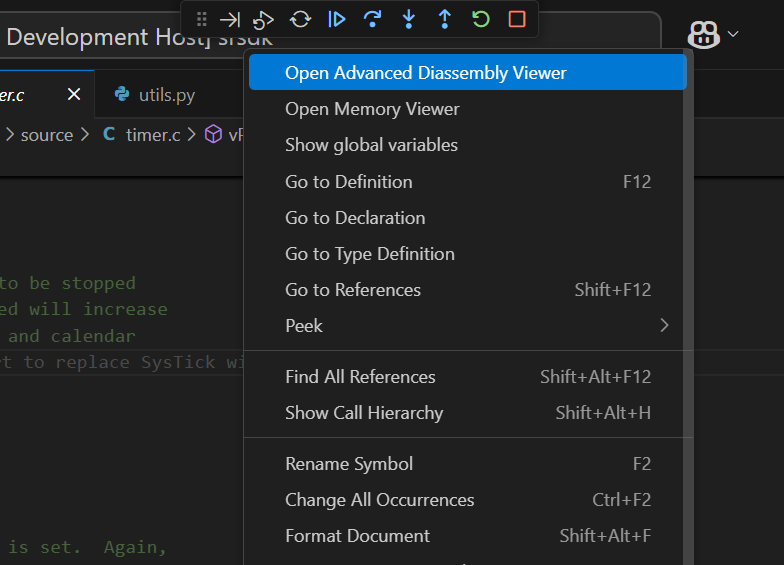
Figure Open Advanced Disassembly Viewer button
The basic disassembly view at the left will display the disassembly and facilitates setting breakpoint at a specific address.
The custom disassembly panel at the right adds navigation controls:
Address Input: To jump directly to a specific address to view its corresponding instruction.
Go to PC: Instantly scrolls to the current Program Counter, helping track the instruction currently being executed.
Go Back: Navigates to the previously viewed disassembly address.
Go Forward: Returns to the next address in the history.
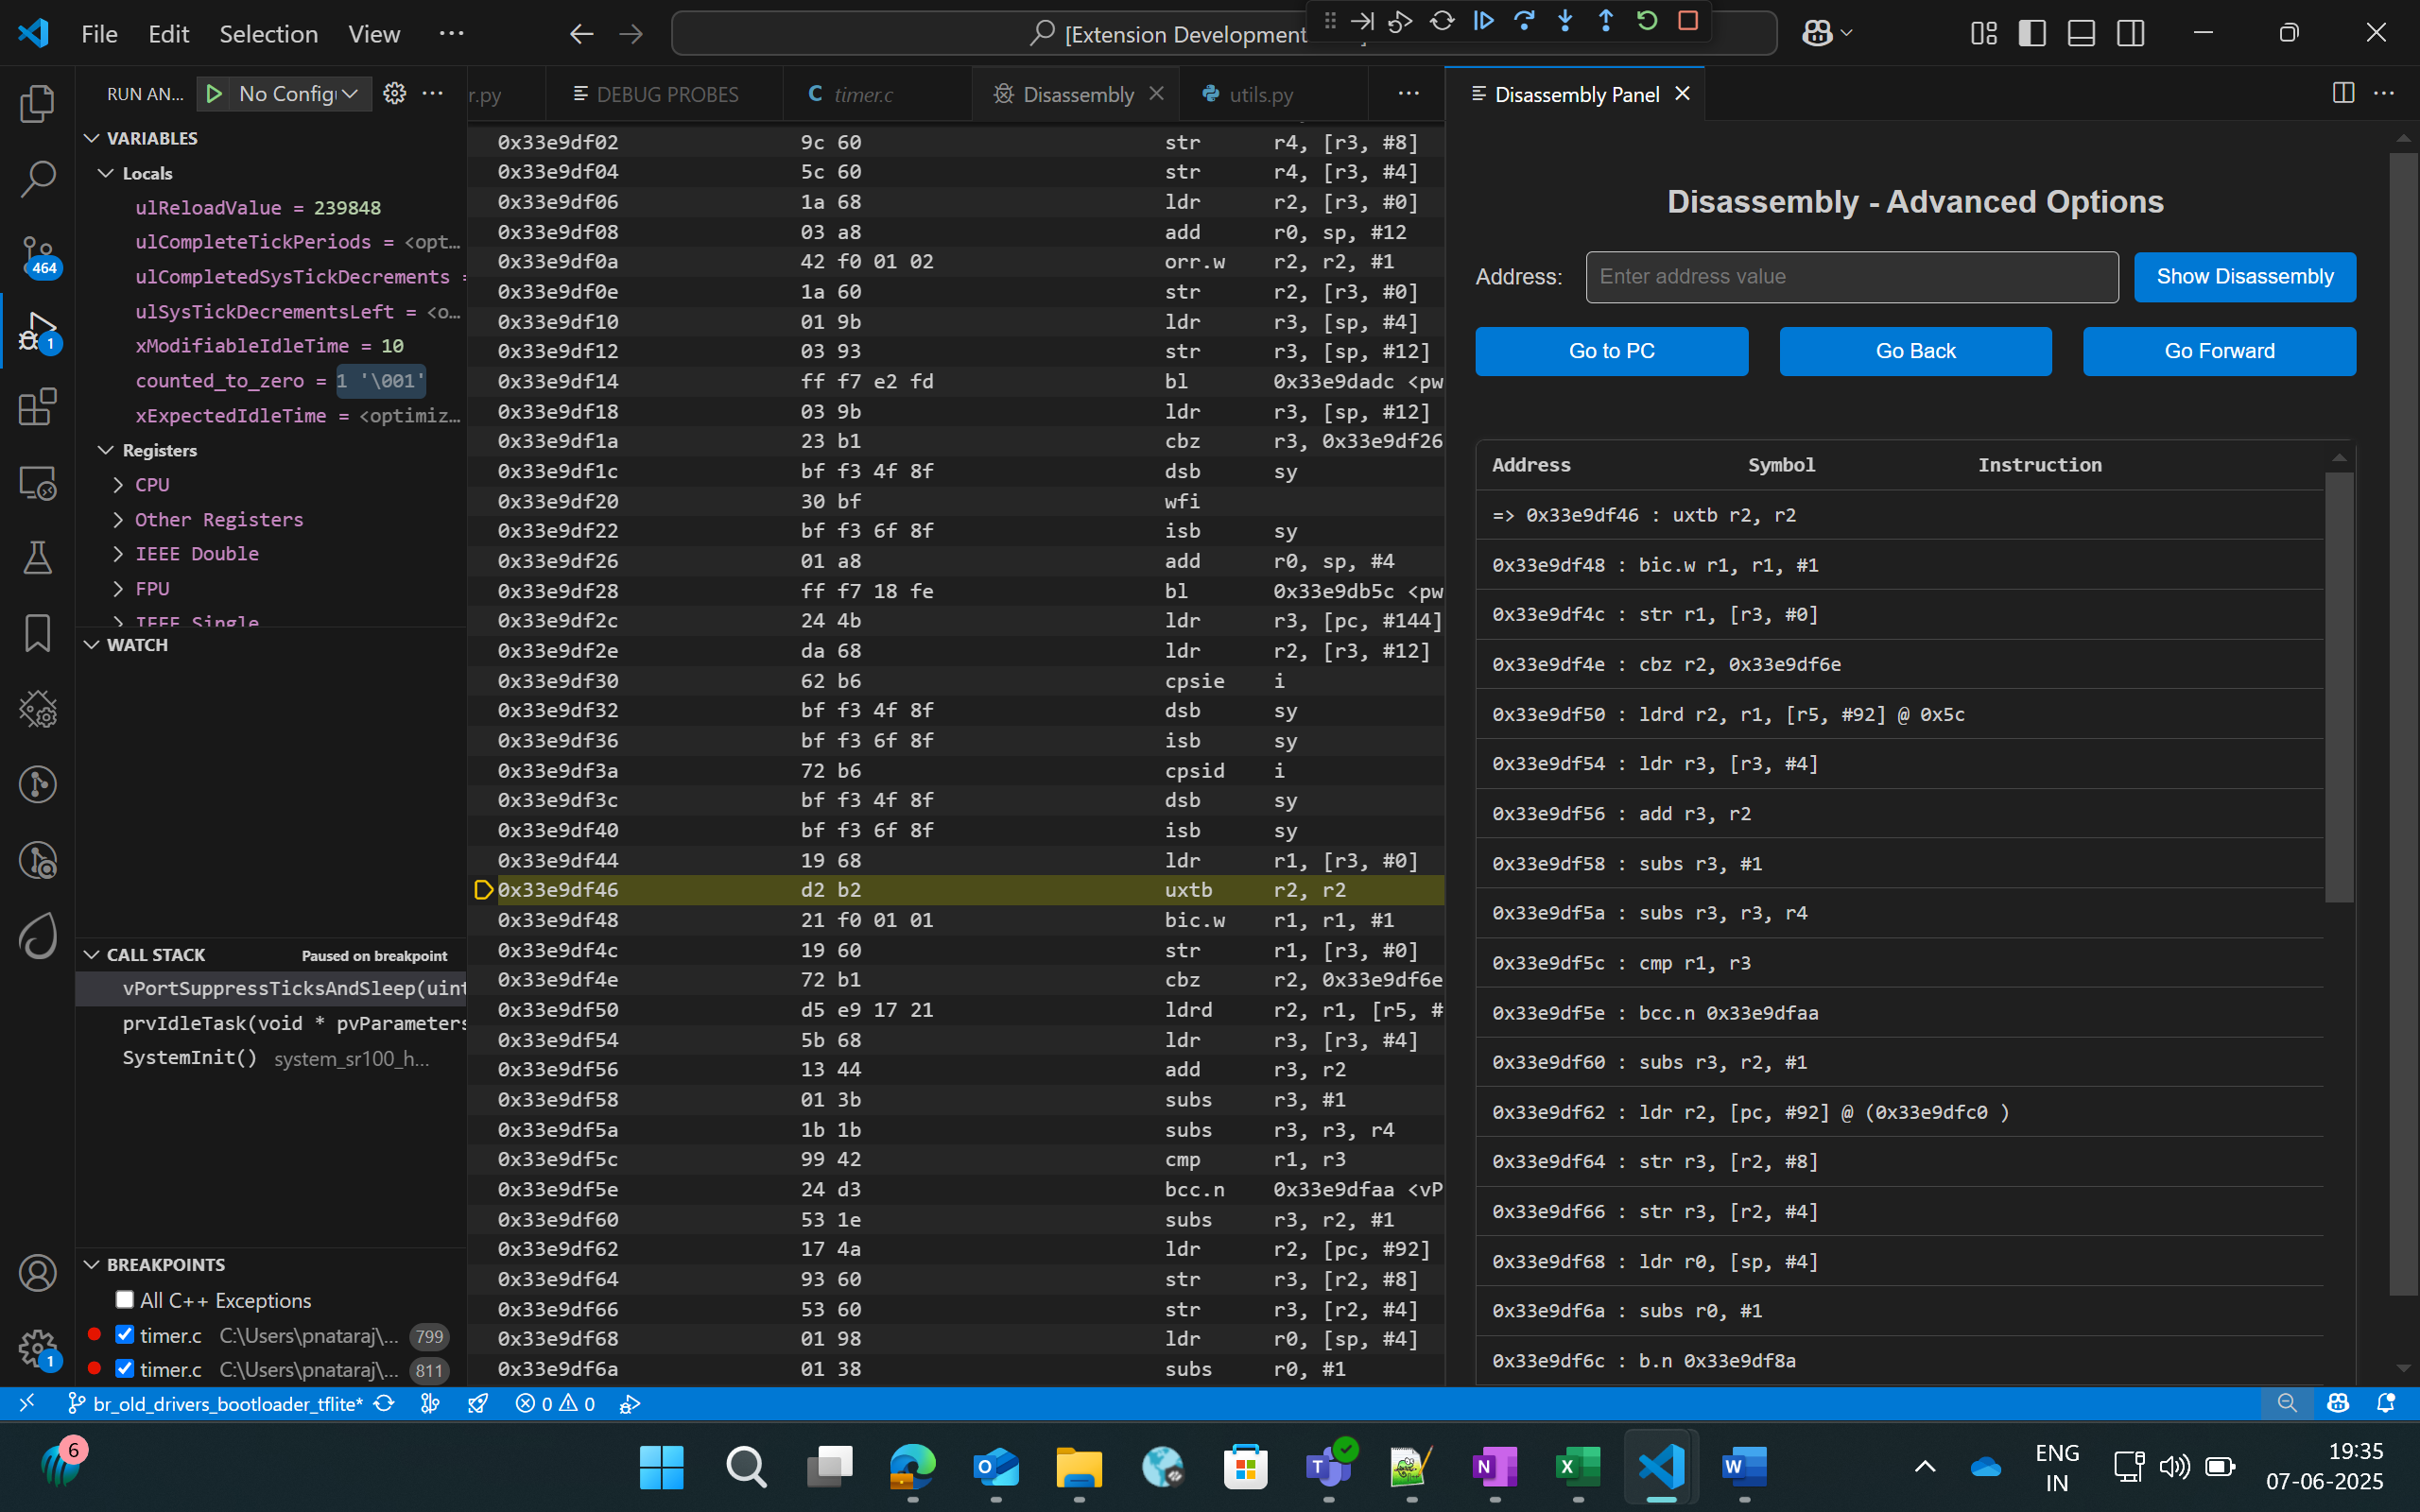
Figure Advanced Disassembly Panel
Logging
Steps to redirect logs to the OpenOCD terminal while debugging:
Click on “Edit Configs” button to open the menuconfig interface in Build SDK panel, select COMPONENTS CONFIGURATION -> Utilities -> LOGGER_DEFAULT_INTERFACE and set LOGGER_IF_CONSOLE or LOGGER_IF_UART_1_CONSOLE.
Save this config and then build for Debug build type.

Figure Viewing logs in OpenOCD terminal
Steps to view the logs using DAP logger port while debugging:
Ensure that Serial Monitor extension is installed.
Once the debug session has started, in Serial Monitor tab, select the DAP logger port and click “Start Monitoring”.
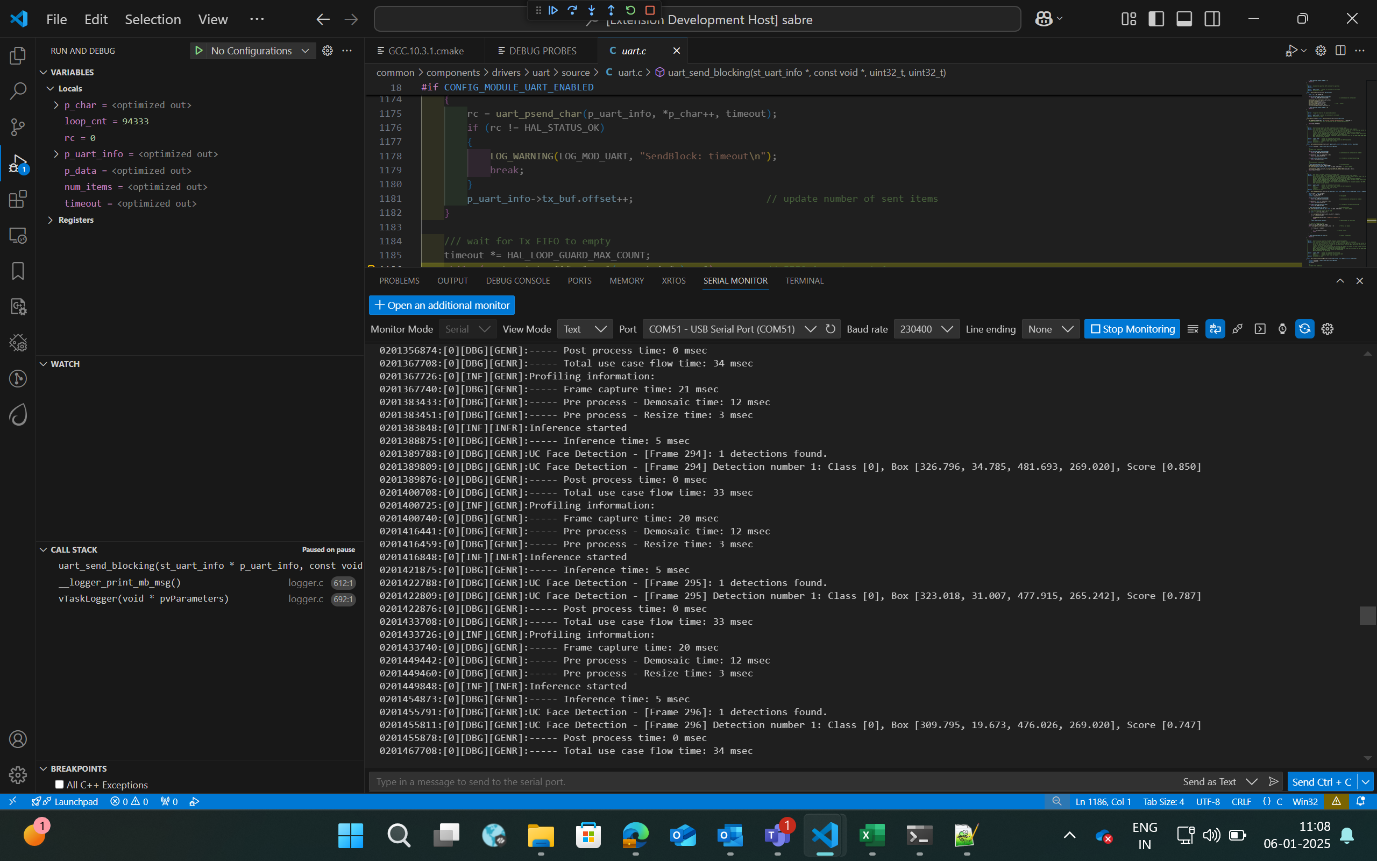
Figure Viewing logs in Serial Monitor
Attach to Running Program
Follow the steps illustrated in Download and Reset Program for selecting the configurations and then you can click on “Attach to Running Program”. This option will attach to the already loaded and running binary in the device, enabling you to pause and inspect the memory and program flow.
If you pause the debugger, you can view the variables, call stack, disassembly view and registers by selecting the appropriate options.
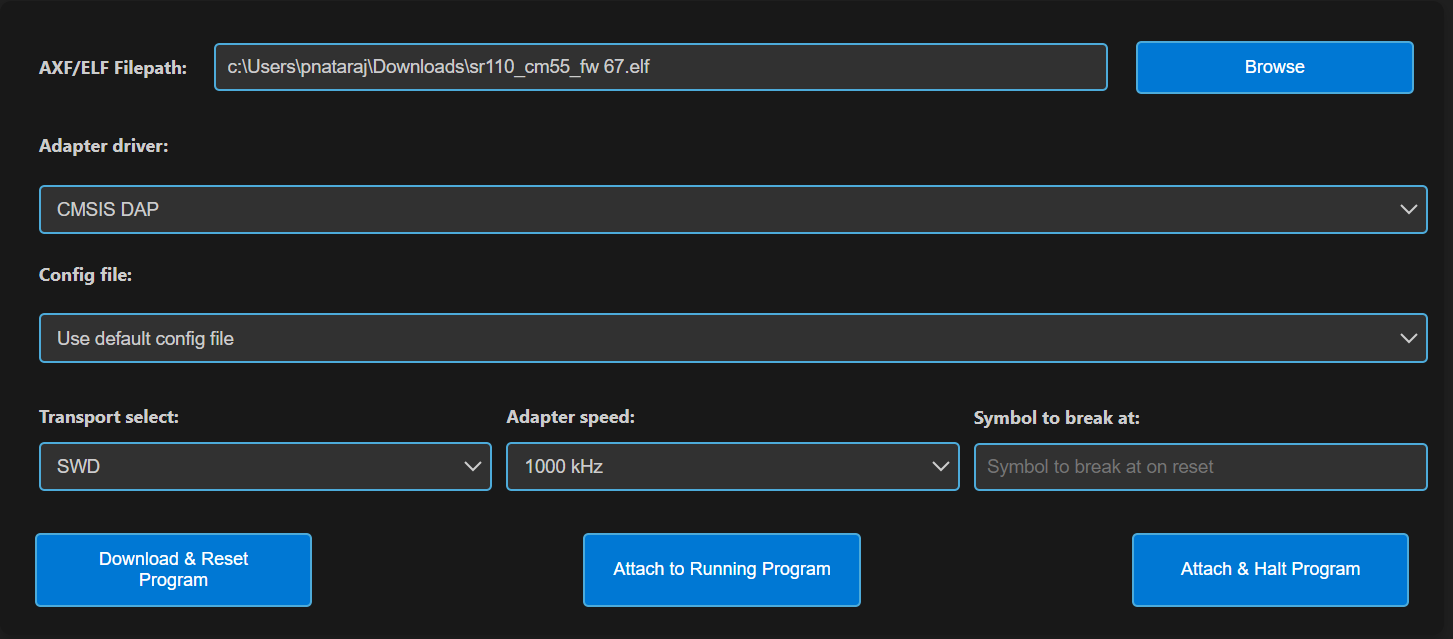
Figure Attach to Running Program
Attach and Halt Program
Follow the instructions outlined in the Download and Reset Program section to select the appropriate configurations. Then, click on “Attach and Halt Program” to attach to the already running binary on the device. This option will attach and pause execution, enabling you to inspect memory and analyse the program flow.
If you pause the debugger, you can view the variables, call stack, disassembly view and registers by selecting the appropriate options.
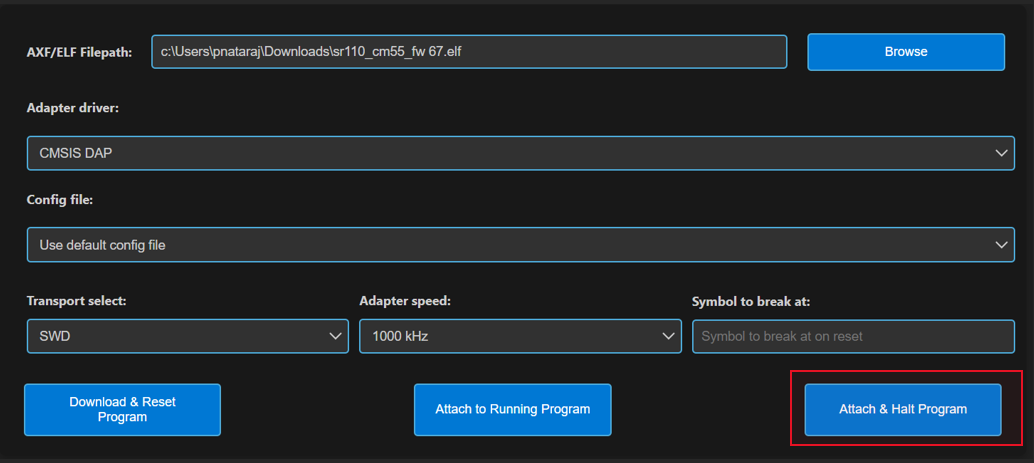
Figure Attach and Halt Program
Video Streamer
Purpose: The Video Streamer option is used to stream the video output of frames while the usecase is being executed.
Figure Video Streamer
Pre-requisites:
Install Python and necessary packages using the “SRSDK Tools Installer” tab to ensure proper working of video streamer.
Ensure that the usecase binary to be tested is flashed onto the device and the target device is properly connected to the system prior to starting video streamer.
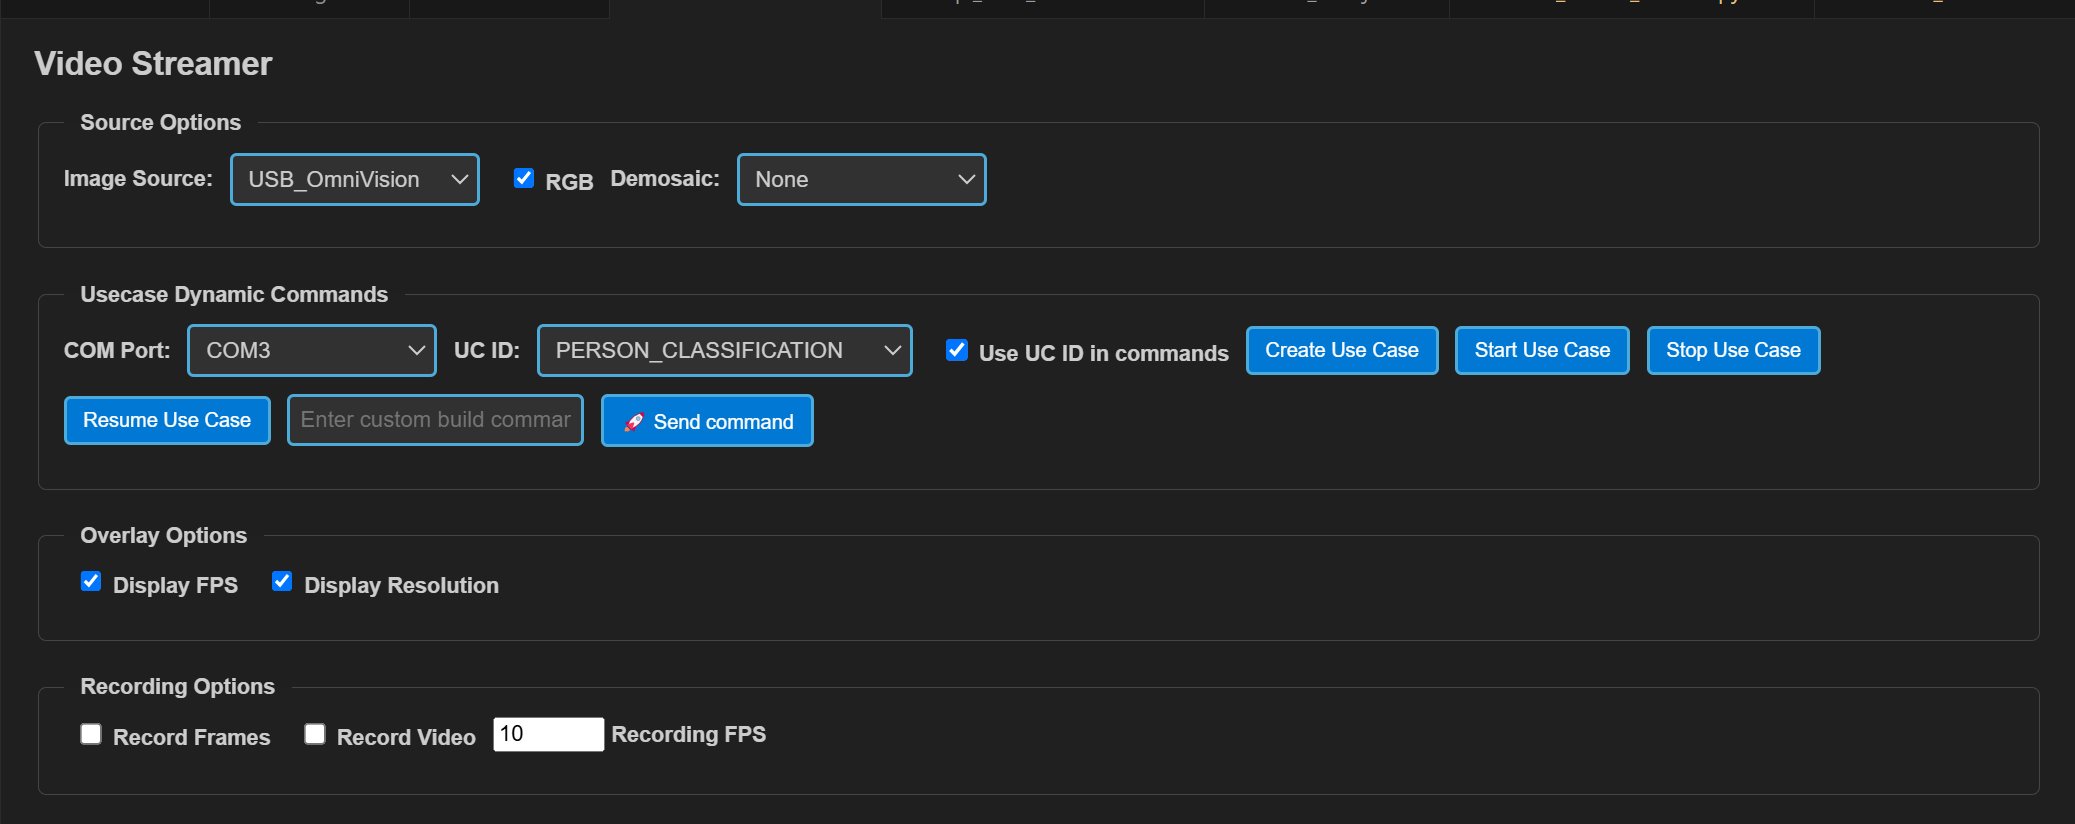
Figure Video Streamer Webview
Steps for Vision Usecases:
Source Options:
RGB: If checked, frames will be displayed in RGB format, or it will be displayed as gray frames.
Demosaic: Facilitates the configuration of required demosaic type from the dropdown.
Overlay options: The display of FPS and Resolution can be customized in this tab. When enabled, FPS and Resolution will appear on the frame.
Recording options:
Record Frames: If enabled, raw frames and overlayed frames will be saved.
Record Video: If enabled, the frames will be saved as video.
Recording FPS: You can vary the FPS in which the video should be saved using the Recording FPS option.
These recordings can be found at:
For windows: C:/Users/<username>/video_stream_output
For Linux and macOS: /home/<username>/video_stream_output
Usecase Dynamic Commands:
Select the appropriate options from the dropdown. Once the usecase binary is properly flashed to the device, CDC ports will be listed in COM Port dropdown. Select the CDC port, select the usecase ID, and click “Create Use Case”.
Custom build commands can be entered in the textbox and click “Send command”.
Once the usecase is created, click “Start Use Case” button. This will start the usecase and the Video Stream will be shown as a pop up.
Click on “Stop Use Case” button to stop the video stream and click on “Resume Use Case” button to resume the video stream.
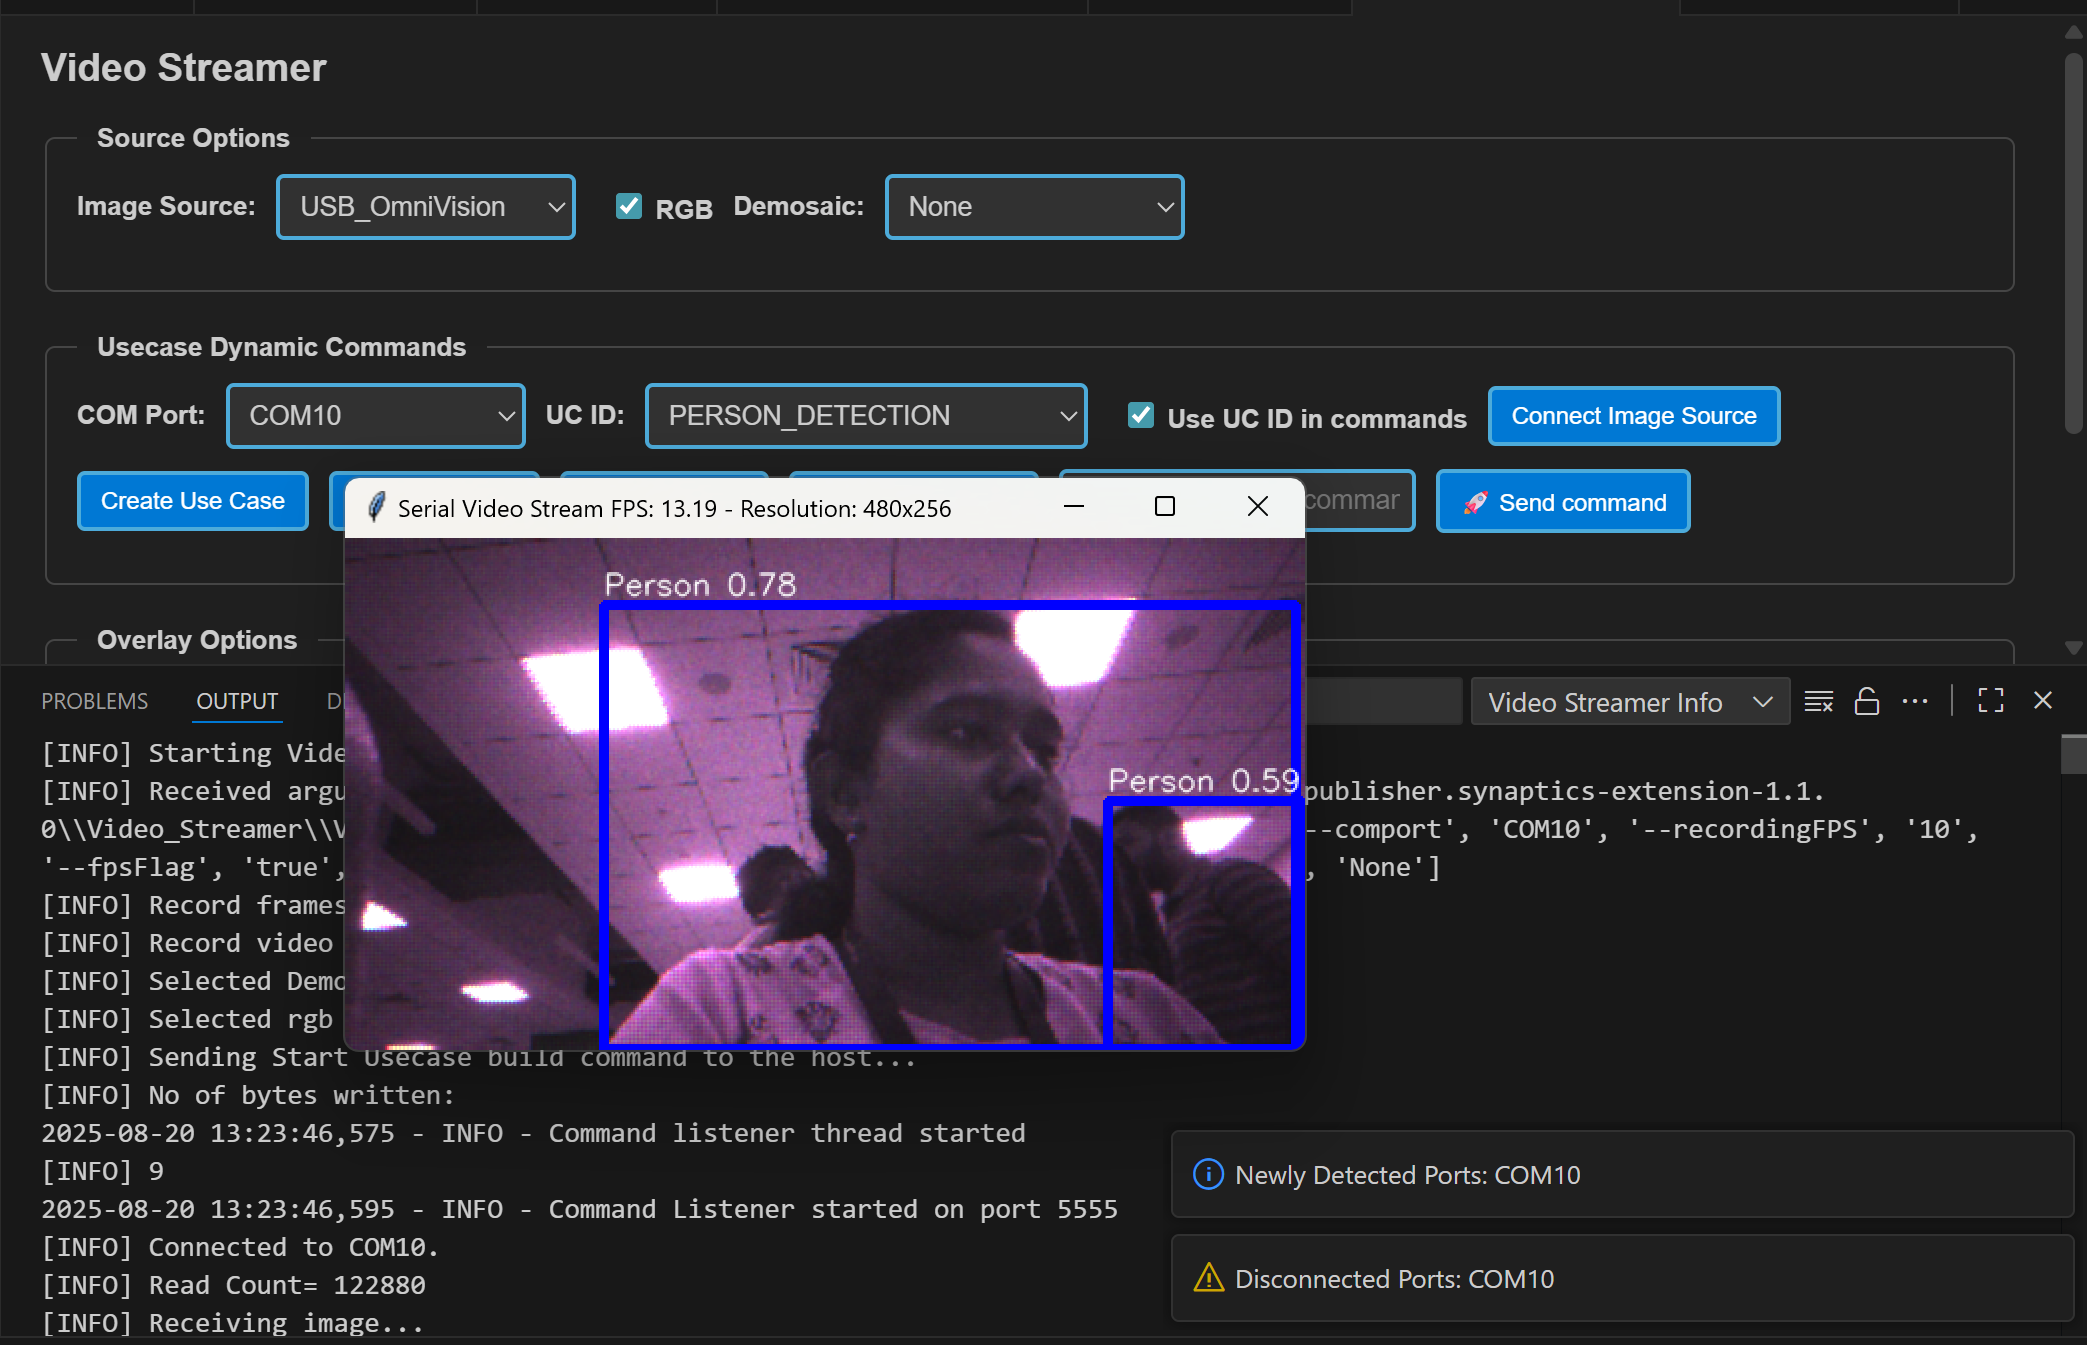
Figure Video Streamer for Person Detection
Doorbell Usecase:
The Doorbell use case is an auto-run application that does not require create or start use case commands. It integrates the UC_JPEG_PREROLL and IMAGE_STITCHING use cases to detect a person and capture, then display, raw and high-resolution images upon detection. For detailed information, refer to Doorbell User Guide.
Steps for Doorbell Usecase:
Open the ‘LOGGER’ tab located in the lower panel of VS Code.
From the dropdown menu, select the logger port, choose the appropriate baud rate, and click ‘Connect’.
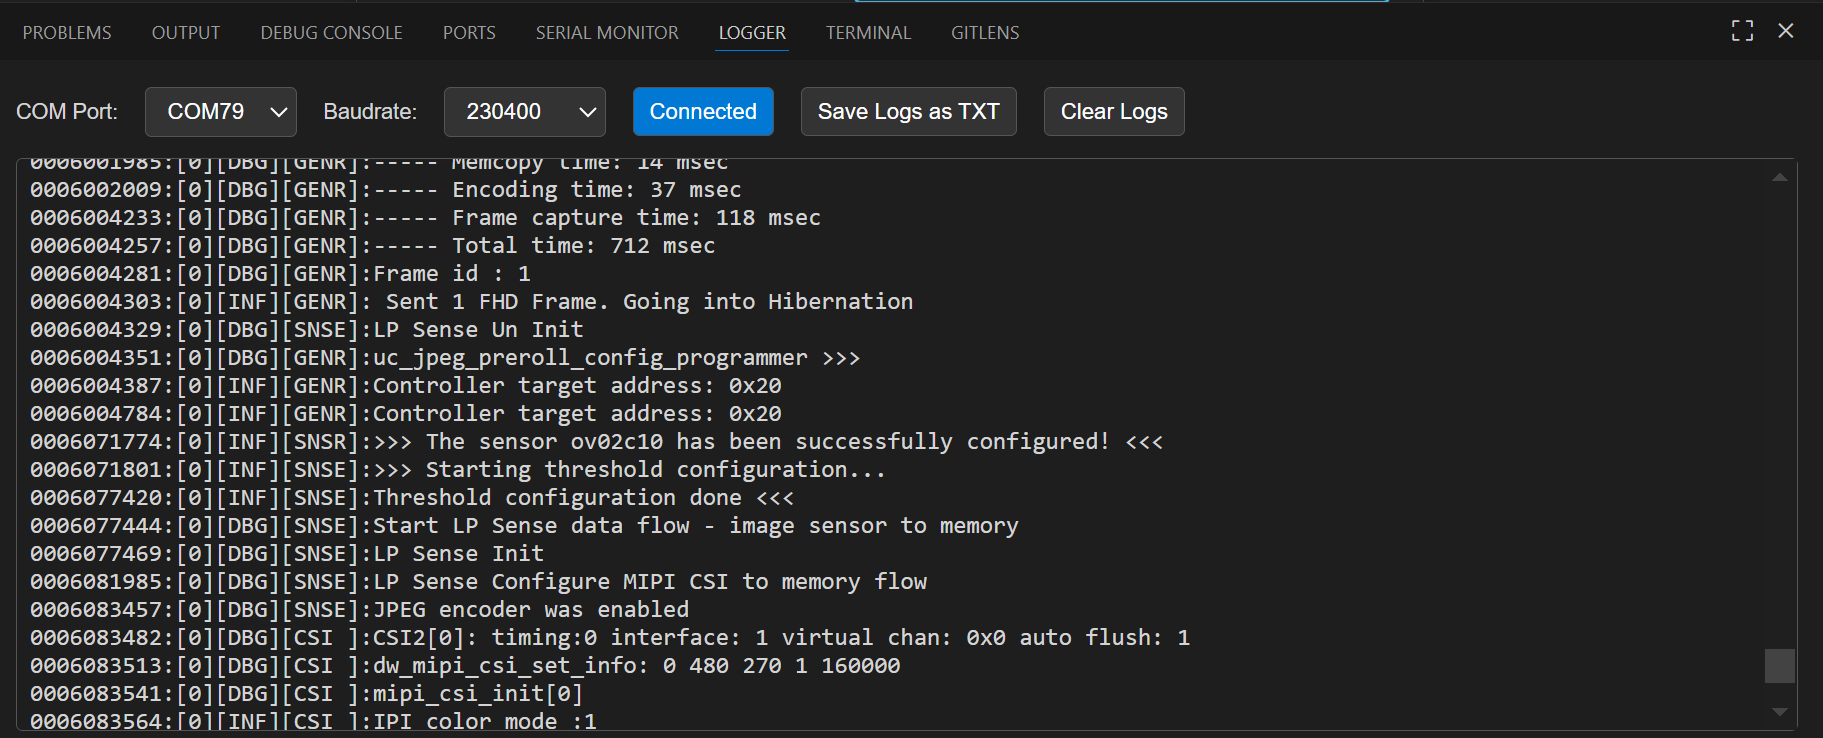
Figure Logger tab
Now press Application chip RESET. Once the use case starts running, logs will appear in the logger window. If there is a detection when the device wakes up, the video stream will be triggered automatically.
The recorded frames and video will be saved at,
For Windows: C:/Users/<username>/video_stream_output
For Linux and macOS: /home/<username>/video_stream_output
You can save the logs as a text file using the ‘Save logs as TXT’ button and clear the logs using the ‘Clear logs’ button.
Wakeup Triggers
Timer (CONFIG_WAKEUP_TRIGGER = 1):
Device wakes up every 10 seconds
GPIO (CONFIG_WAKEUP_TRIGGER = 2):
Keep one end of the jumper cable connected to GND
Wait at least 10 seconds after the device enters hibernation, then connect the other end of the jumper to the UART0 RX pin to trigger the wake-up
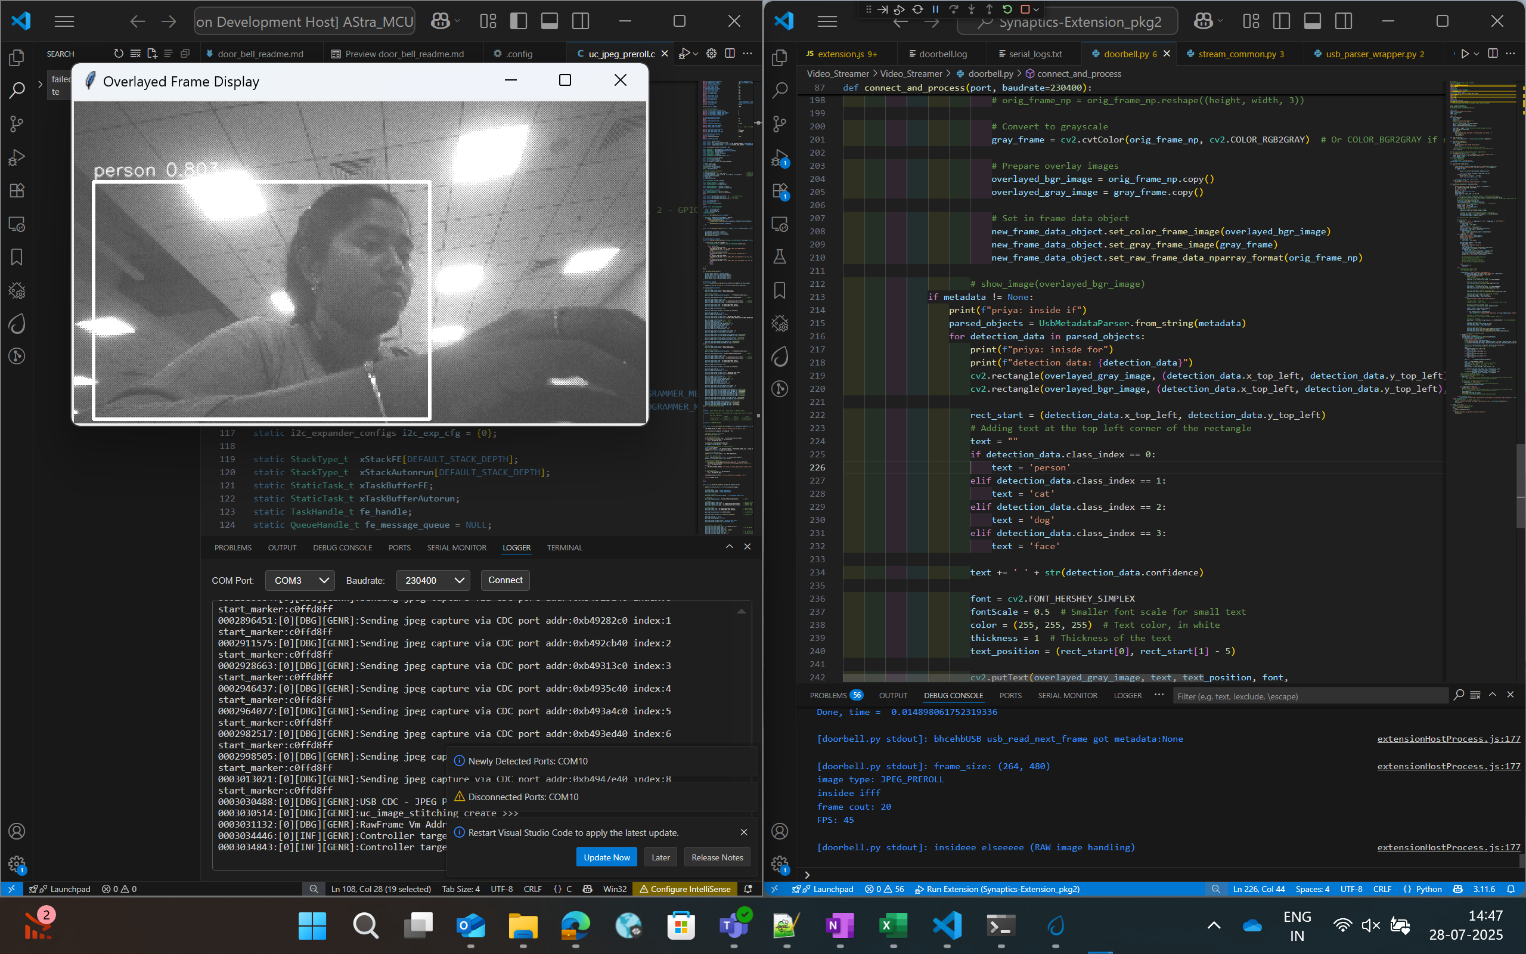
Figure Doorbell usecase video stream
Steps for Autorun Usecases:
Select the usecase from the “UC ID” dropdown and click “Connect Image Source” button.
This will display the video stream of the usecase which started running.
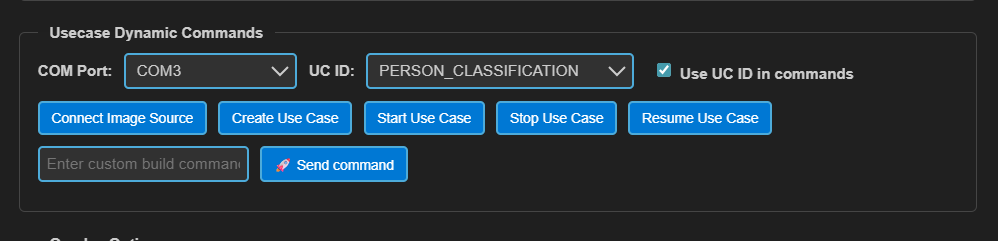
Figure Connect Image Source button