Astra MCU SDK - VS Code Extension User Guide
This guide provides instructions for using the Astra MCU SDK VS Code Extension to develop, build, and flash projects for various Synaptics SoCs. It covers everything from initial environment setup and tool installation to advanced debugging and video streaming workflows.
Throughout this guide, <sdk-root> refers to the directory where you extracted or cloned the SDK.
Table of Contents
Supported SoCs
This extension supports multiple SoC families. The core workflows (installation, tools, SDK import, logging, and memory analysis) are common across all devices.
For SoC-specific features such as build configurations, image generation, flashing, and debugging, refer to the appropriate platform-specific guide:
SR110: See SR110 Build and Flash with VS Code
SL2610: See SL2610 Build and Flash with VS Code
Throughout this guide, sections marked with 🔧 indicate SoC-specific functionality—consult your device’s platform guide for detailed instructions.
Prerequisites
Supported host OS: Windows x64, Linux x86_64 or aarch64 (Ubuntu 22.04), macOS x86_64 or ARM64.
Note: For SL2610 development only Linux hosts are supported (WSL with Ubuntu 22.04 is supported). See Astra MCU SDK - WSL User Guide.
Windows users can now use WSL2 (Ubuntu 22.04) for a full Linux-native development experience. WSL is fully supported for Flashing and Video Streamer using integrated usbipd support. See the VS Code WSL guide and the Astra MCU SDK - WSL User Guide.
Visual Studio Code installed.
Install the Synaptics VS Code Extension
Click the Extensions icon on the side bar, click the three dots at the top right of the extensions window, and select Install from VSIX…
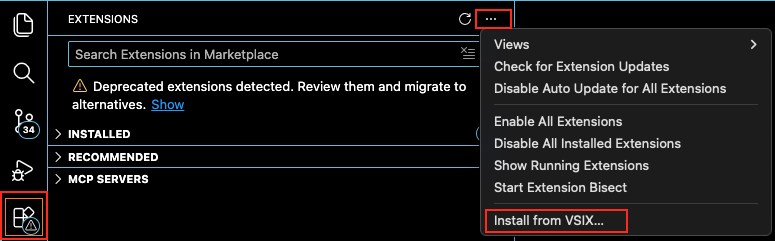
Locate the VSIX package in
tools/(for example,Astra_MCU_SDK_vscode_extension-<version>.vsix), and click Install.Confirm the Synaptics extension appears in the VS Code activity bar.

Close and then reopen VS Code.
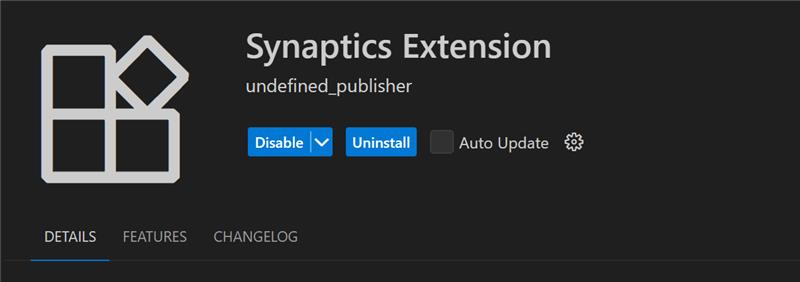
Uninstall old package and reinstall
Remove the currently imported Example directory from the workspace using the Remove from workspace option.
Uninstall the current extension using the Uninstall button.
Close any active Webview or reload the window.
Install the new extension VSIX package using the steps above.
Install Tools
Purpose: Check and install the necessary tools for build, image generation, flashing, and debugging.
Tools checking
Steps:
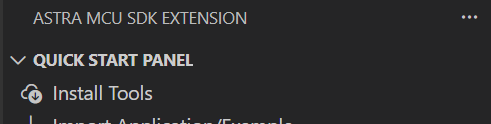
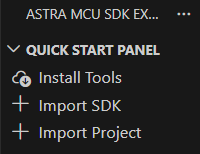
Open the Synaptics extension sidebar and select Install Tools.
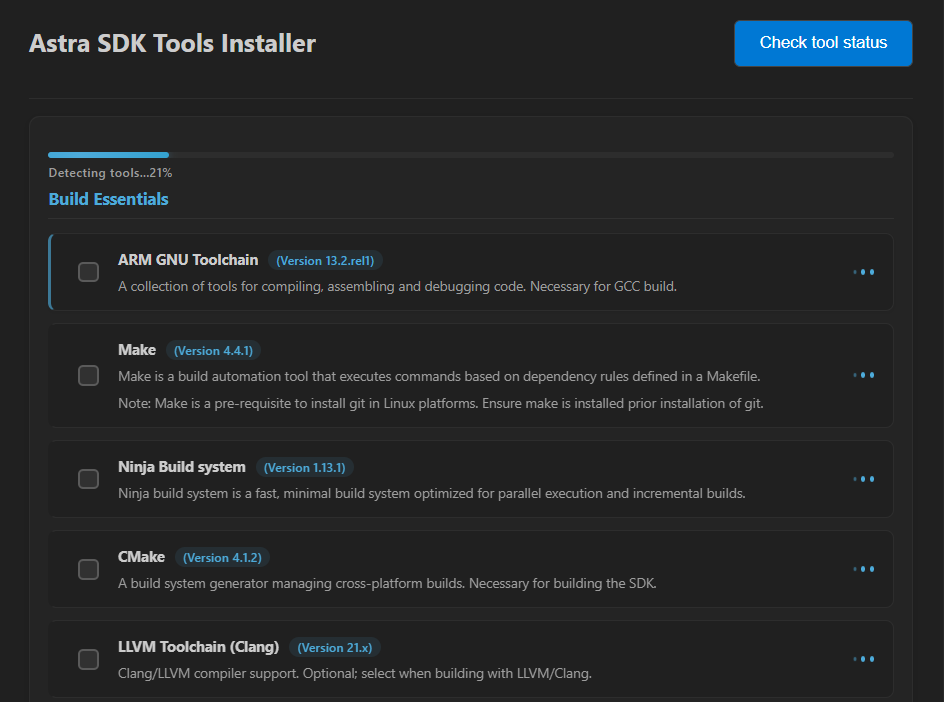
The tool check runs automatically when the panel opens.
You can click Check tool status to re-run it at any time. A loader shows progress.
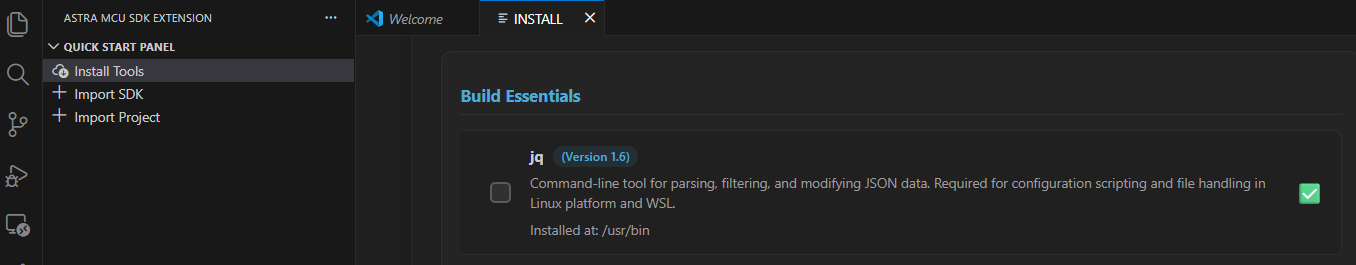
Note: On Linux and macOS, jq is required to read and write settings.json. If it is not installed, a terminal will open and prompt for your password. Once installed, the tool check continues automatically.
Note: If you are updating from a older version of the extension please reinstall the required tools
Result:
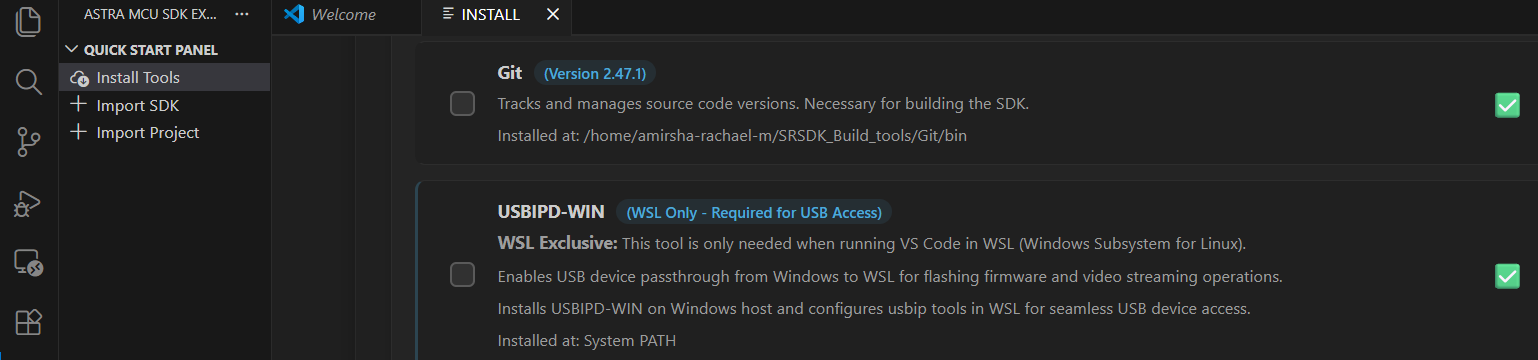
If a tool is missing, its version does not match or a migration warning, an exclamation mark (⚠️) will be displayed, and the installation checkbox will be automatically selected.
If a tool is already installed with the correct version, a green checkmark (✅) will appear, and the installation checkbox will remain unselected.
Tools installation
Steps:
After the tools check, choose an install directory or use the default:
Windows:
C:/Users/<username>/SRSDK_Build_toolsLinux:
/home/<username>/SRSDK_Build_toolsmacOS:
/Users/<username>/SRSDK_Build_tools
Click Install. The install script runs in the Install Script Terminal with progress shown in the UI.
Note:
On Linux and macOS, you will be prompted for your password in the Install Script Terminal.
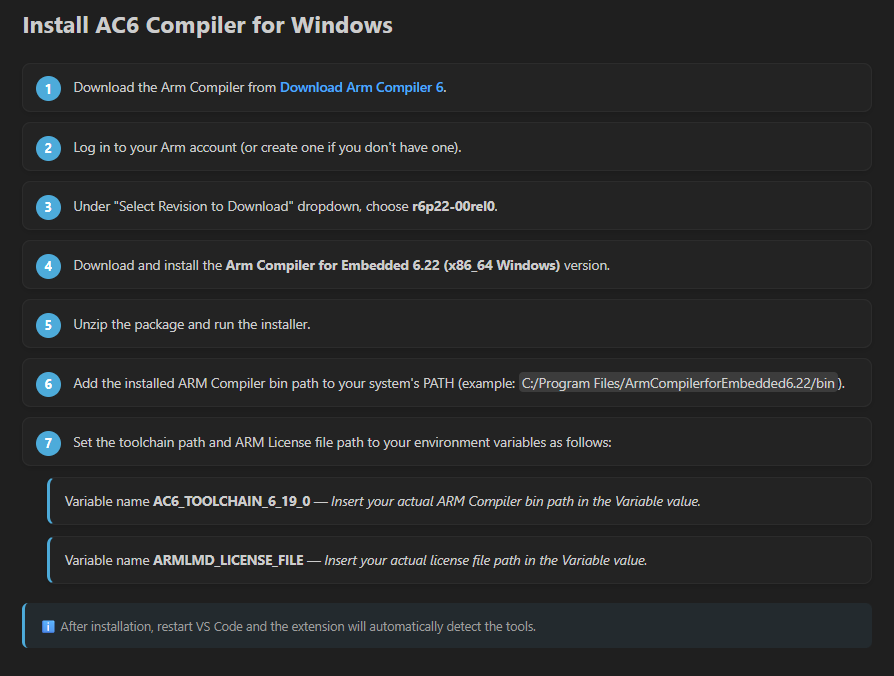
Note for AC6:
Arm Compiler 6 requires manual installation due to licensing constraints. Follow the steps shown in the Tools Installer webview.
Note for WSL Users:
Ensure you check the USBIPD-WIN box in the tool list to enable device passthrough for flashing video streaming and debugging.
Manual download fallback (if tool download fails):
If a tool download fails in the Install Script Terminal (for example due to restricted network, proxy, or CDN access), use this fallback:
Run Install once and note the failed installer filename shown in terminal output.
Download the same installer manually from the official vendor website.
Copy the downloaded file to the extension temporary tools folder.
Windows example:
%USERPROFILE%/SRSDK_Build_tools/tempLinux/macOS example:
<home>/SRSDK_Build_tools/temp
Run Install again from the tools installer page.
If the local file name matches the expected package, the installer uses the local file and continues installation.
Note: This workaround is especially useful on restricted networks where automated script downloads may be blocked.
After installation: Close and reopen VS Code.
VS Code extensions installed by the tools installer:
C/C++ (Microsoft) for IntelliSense and debugging
Serial Monitor
MemoryView
Memory Inspector CDT
Linux USB/serial permissions (recommended)
On Linux, add your user to the dialout group so the flashing tools can access USB CDC/UART devices:
sudo usermod -aG dialout $USER
Log out and log back in (or reboot) for the group change to take effect.
Standalone Image Flashing (No SDK Import Required)
Purpose: Flash a prebuilt image (.bin/.img) directly to the target SoC without importing the SDK into the workspace.
Prerequisite: Complete Install Tools first. This feature depends on the required flashing tools (for example OpenOCD and Python environment).
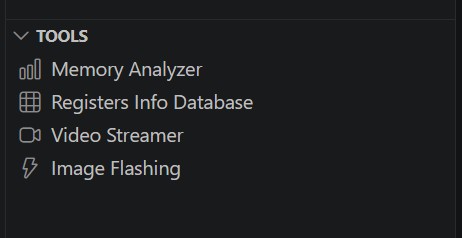
In the Synaptics sidebar, open TOOLS and click Image Flashing.
In the Image Flashing page (shown as STANDALONE MODE), verify the tool status indicators are ready.
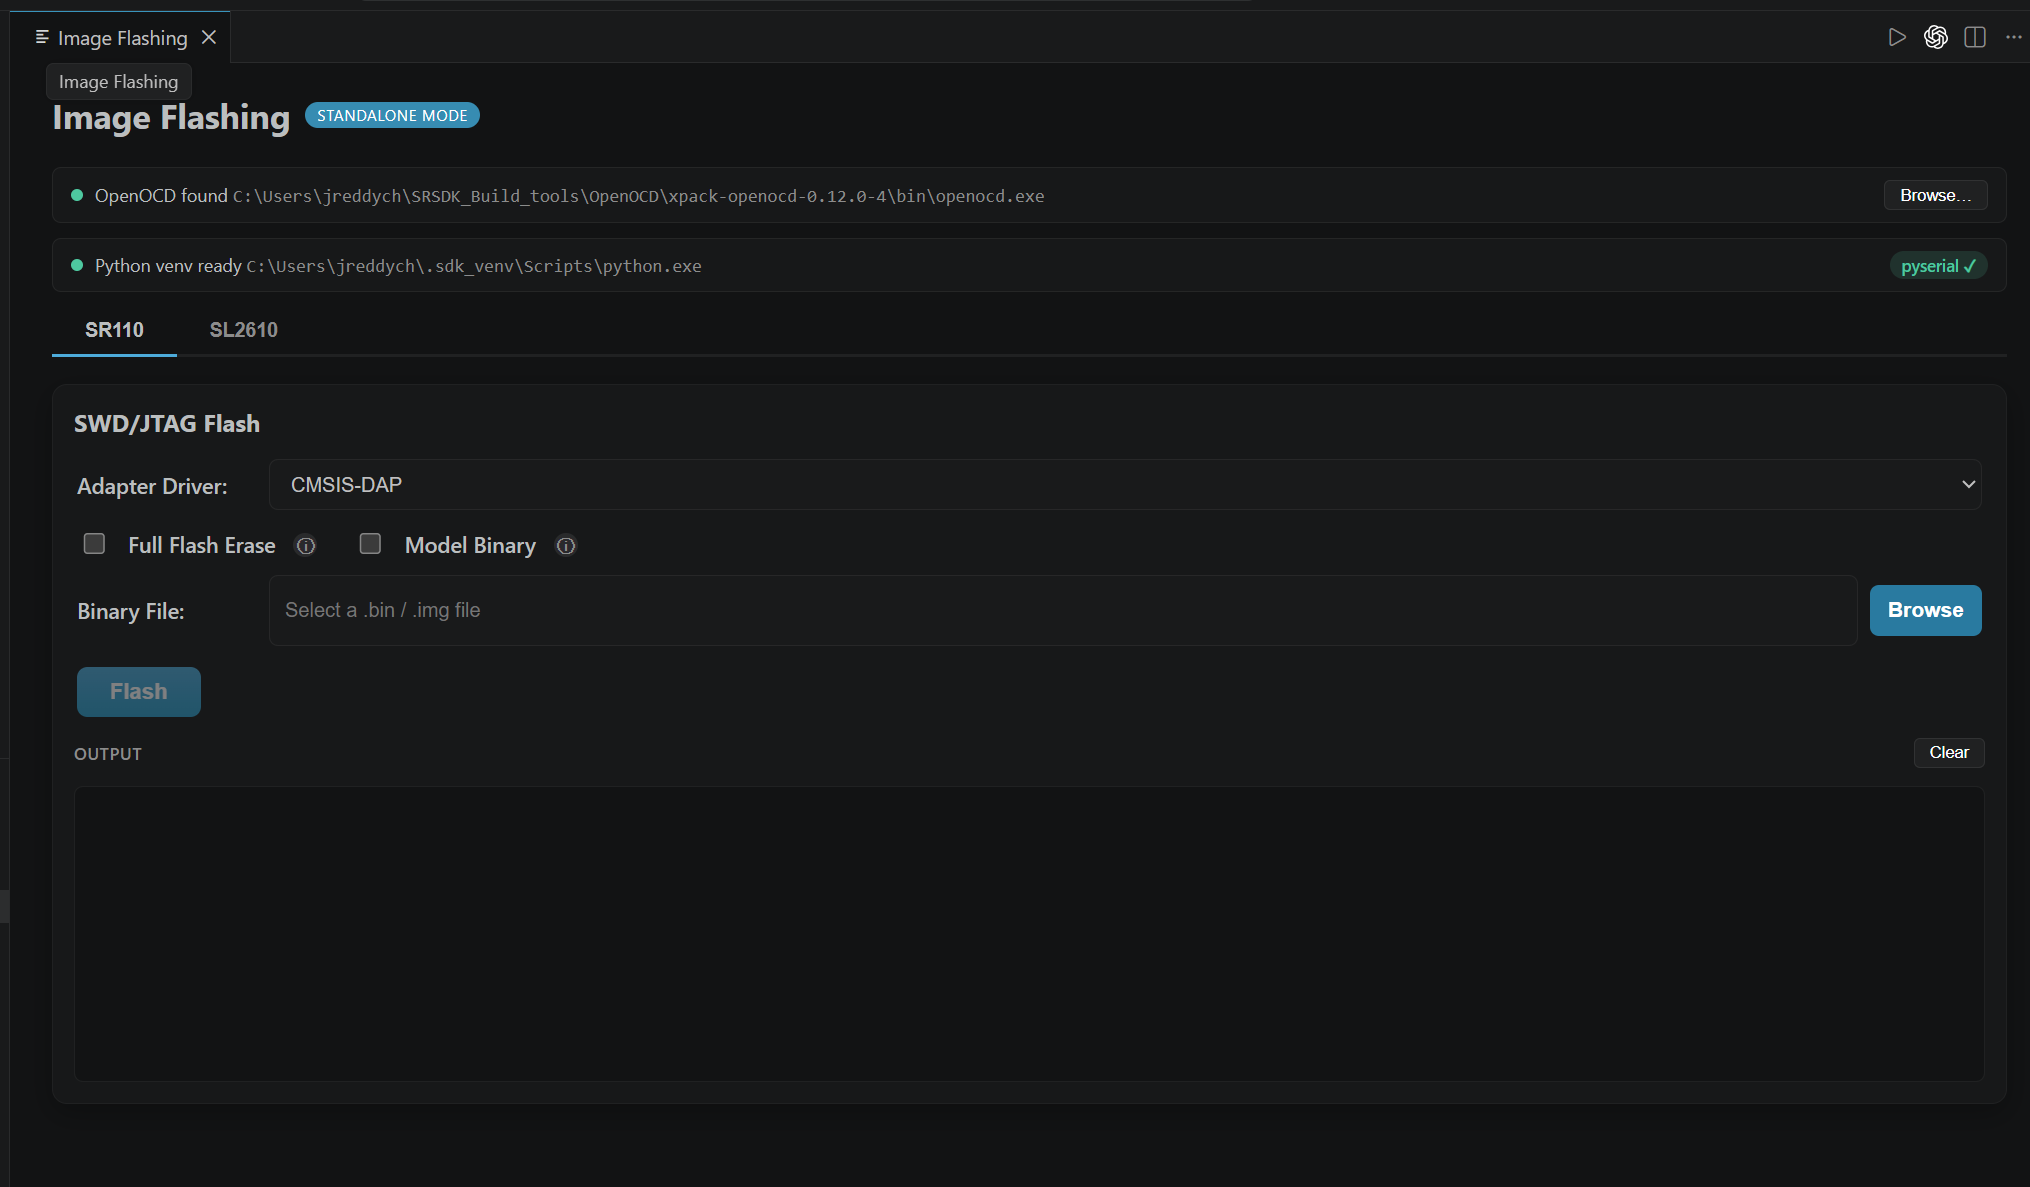
Select your SoC tab (SR110 or SL2610) and configure the flashing options.
Browse and select the prebuilt image file (
.bin/.img), then click Flash.
Note: This standalone flow is intended for flashing an existing image only; SDK import is not required for this operation.
Import SDK and Project
Purpose: Configure the workspace by setting the SDK path <sdk-root>and importing specific project folders, either from a local folder or by cloning a repo. In this version, you can now manage the SDK and multiple projects within the same workspace.
1. Import SDK
Purpose: The Import SDK action adds the SDK to your workspace and configures the SRSDK_DIR path in settings.json. If you only need to update the path without importing the physical folder, simply select the checkbox to set the SRSDK_DIR only.
Steps:
Open the Import SDK view from the
Quick Start Panelin the Synaptics sidebar.Local Import: Under the LOCAL tab, click BROWSE SDK FOLDER and select your
<sdk-root>directory.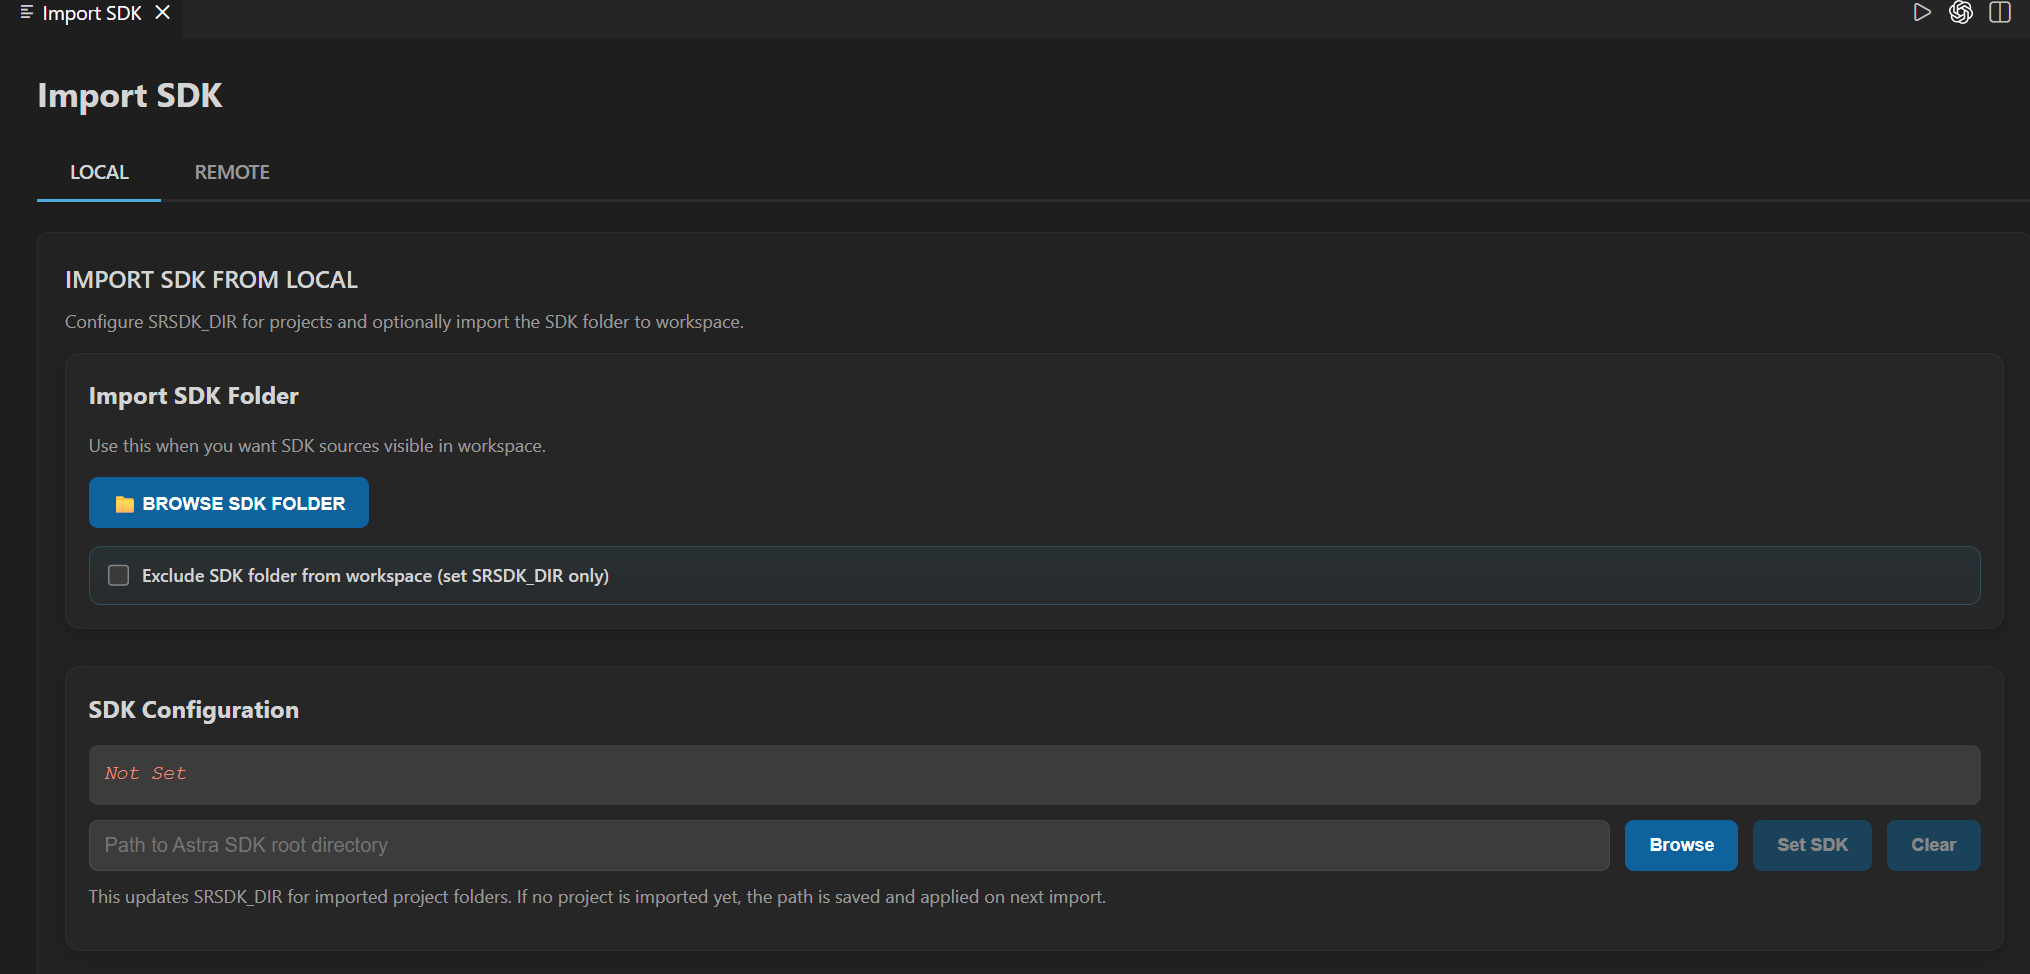
Note: If you do not want to import the SDK root into the workspace, select the checkbox to set the SRSDK_DIR only.
If you want to clear the already set SRSDK_DIR path, click the Clear button.
Remote Import: Under the REMOTE tab, click CLONE REPO, paste the SDK repository URL, and select the local folder to clone into.
Note: GitLab requires proper SSH key setup.
Confirm the selection. The extension updates
settings.jsonand enables the Build and Deploy panels.
2. Import Project
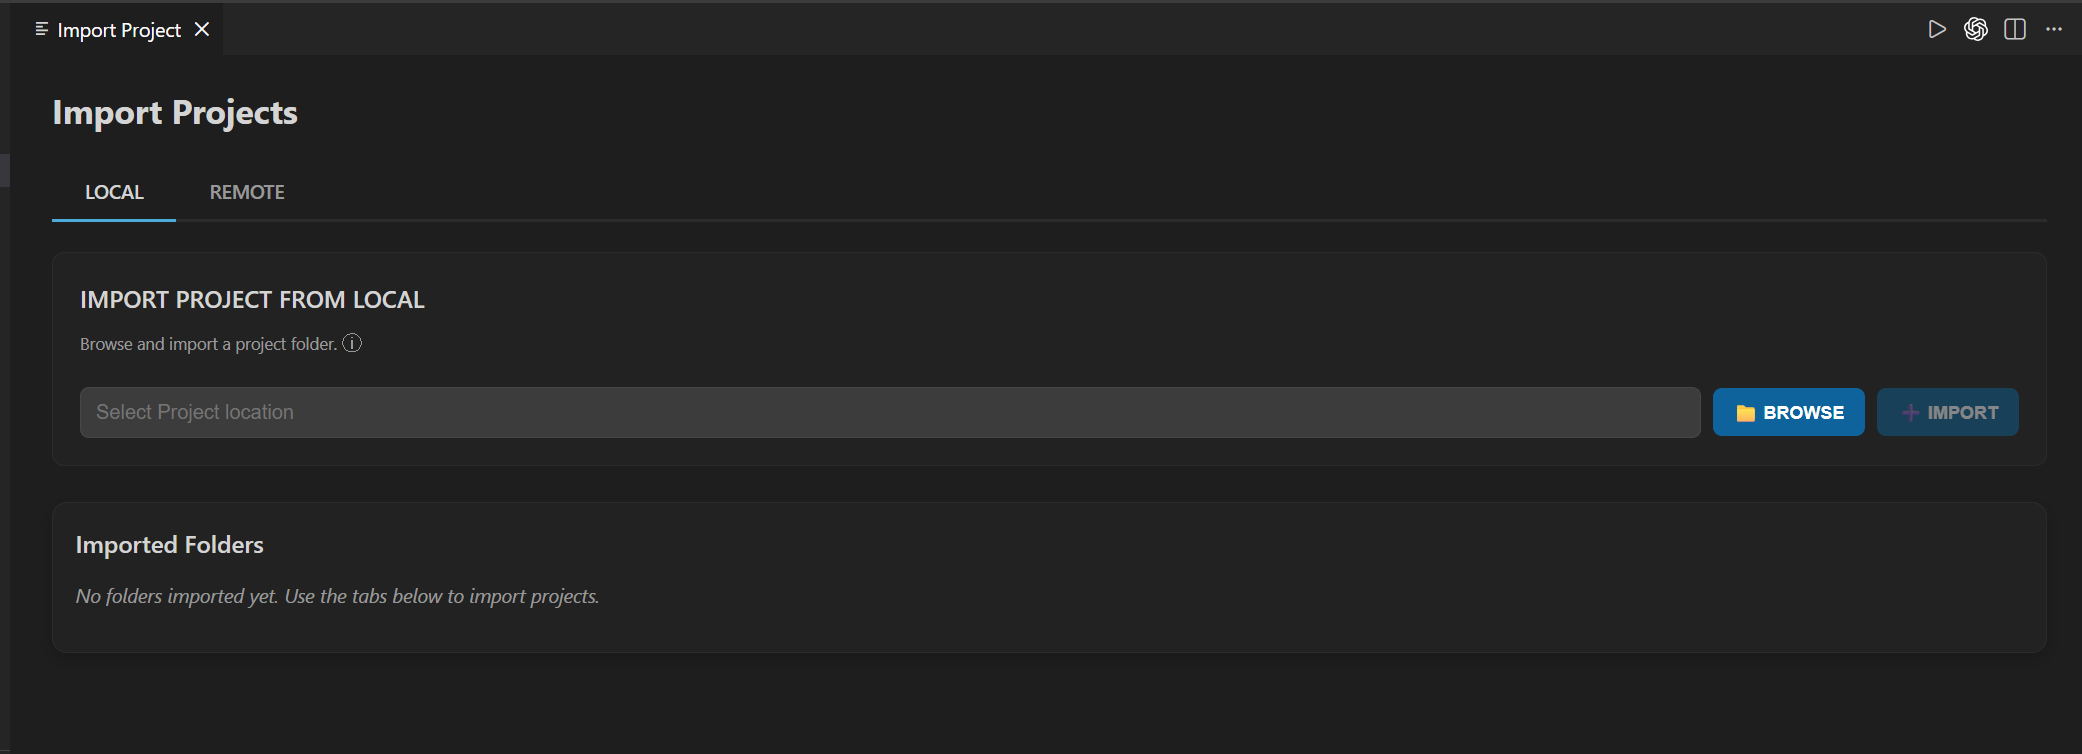
Purpose: Import specific project source code into the workspace. You can now import individual projects separately rather than importing the entire examples directory.
Steps:
Click Import Project under the
Quick Start Panelview.Local Import: Click BROWSE and select the folder you wish to work on:
Projects: Navigate to a specific sub-folder (e.g.,
<sdk-root>/examples/vision_examples/uc_person_detection).
Remote Import: Use the REMOTE tab to clone a specific project repository directly into your workspace.
Confirm the selection. The project will appear in the Imported Projects view.
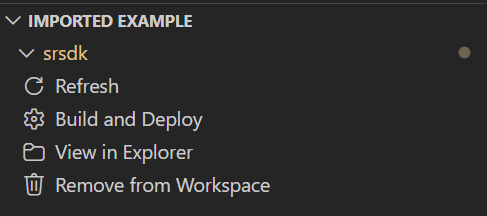
Imported Projects
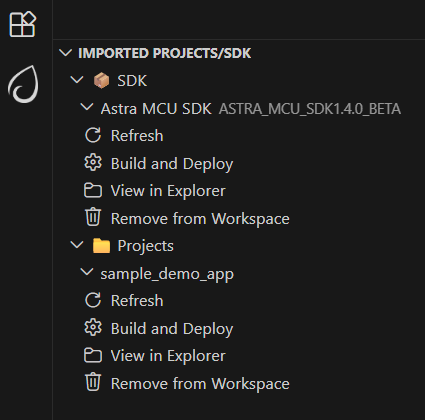
Purpose: Provides a quick interface for managing all projects currently imported into your VS Code workspace.
Options:
Refresh: Reloads the current workspace.
Build and Deploy: Opens the unified interface for the selected project.
View in Explorer: Opens the project folder in the VS Code file explorer.
Remove from Workspace: Removes the selected project from the current workspace.
Note: Version 1.4 now supports importing multiple projects in the same workspace. On Windows, the suggested path length of the imported SDK folder should not exceed 100 characters to avoid build issues.
Build and Deploy
Purpose: Provides a unified environment for building, image generation, flashing, and debugging.
Steps:
Once the required SDK and Project are imported, click Build and Deploy in the
Imported Projectscolumn.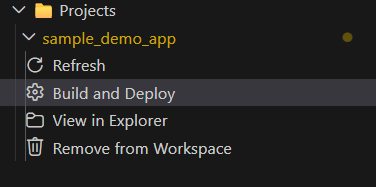
Project Selection: If multiple projects are in the workspace, ensure the correct one is selected in the dropdown menu within the Build and Deploy webview.
Configuration: Select your Build Configuration (e.g., Release/Debug), Board, and Compiler.
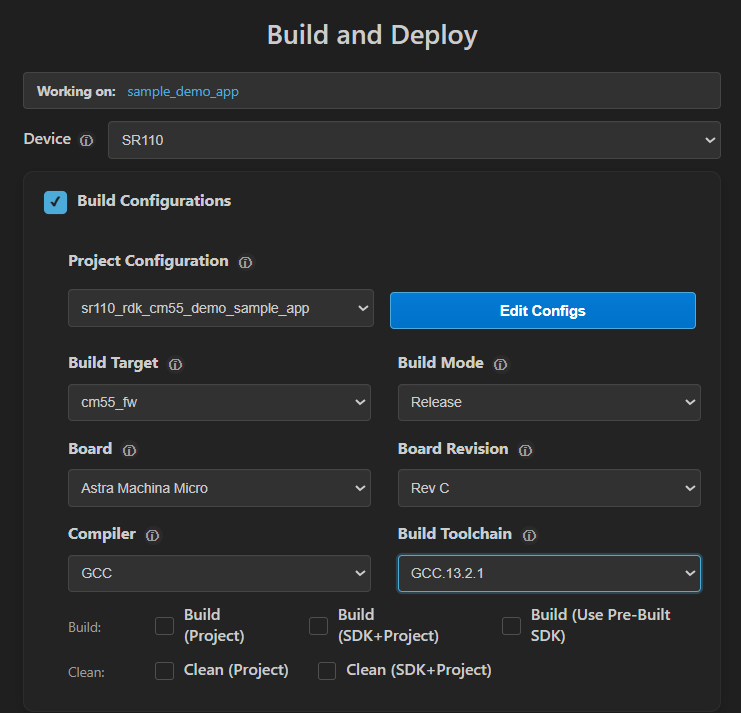
Note: If Build configurations are disabled, verify that
SRSDK_DIRwas set correctly through the Import SDK view. Workflow Description: The Build and Deploy webview is a unified interface for multiple operations. Users can perform either one operation at a time or combination of operations.
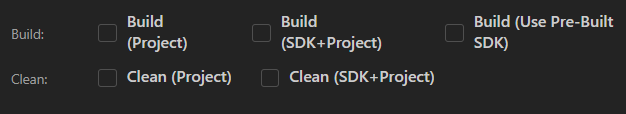
Project Build Options
When building a project, the extension provides four distinct methods to handle SDK dependencies. Selecting the correct option ensures efficient build times and proper management of build artifacts.
Option |
What it does |
When to use it |
|---|---|---|
SDK Build (default_package) |
Generates the core foundation (compiler CMakes and basic packages) in |
First-time setup: Use this to generate the required base package before building projects. |
Build (SDK+Project) |
Builds the SDK components required by the app based on the app configuration, installs them into the app-local install folder, and then builds the example using that generated install package. |
First-time app build: Use this when building an app for the first time and the required SDK components have not yet been generated for that app. |
Build (Project) |
Performs a local build using artifacts generated specifically for the active project. |
Development: Use this when making changes to project-specific code and you require a fresh, isolated build. |
Build (Use Pre-built SDK) |
Links the project to the common install root available in |
Efficiency: Use this to share a common SDK package across multiple apps, saving time and avoiding redundant builds. |
🔧 SoC-Specific Build & Deploy Workflows:
For detailed instructions on building, flashing, debugging, and other platform-specific features, refer to your SoC’s platform guide:
SR110 users: See SR110 Build and Flash with VS Code
SL2610 users: See SL2610 Build and Flash with VS Code
Common Workflow Principles:
Integrated workflow: This unified webview is used to manage SDK build, binary conversion, image flashing and debugging from a single interface. This provides users with two modes of operation:
a. Unified workflow – Users can configure all required options and execute the full workflow in one step. This will build the SDK, generate the binary, and flash it onto the device.
b. Isolated workflow – Users can perform individual steps independently, such as building only the .axf/.elf, generating a binary, flashing an existing binary or debugging.
Panels you will see (common layout):
Build Configurations (select project, build type/mode, board, compiler, toolchain, and app).
Image Generation and Image Flashing (when supported on your SoC).
Debug Options (SR110 only).
The exact options within each panel are SoC-specific; follow the platform build-and-flash guides for details.
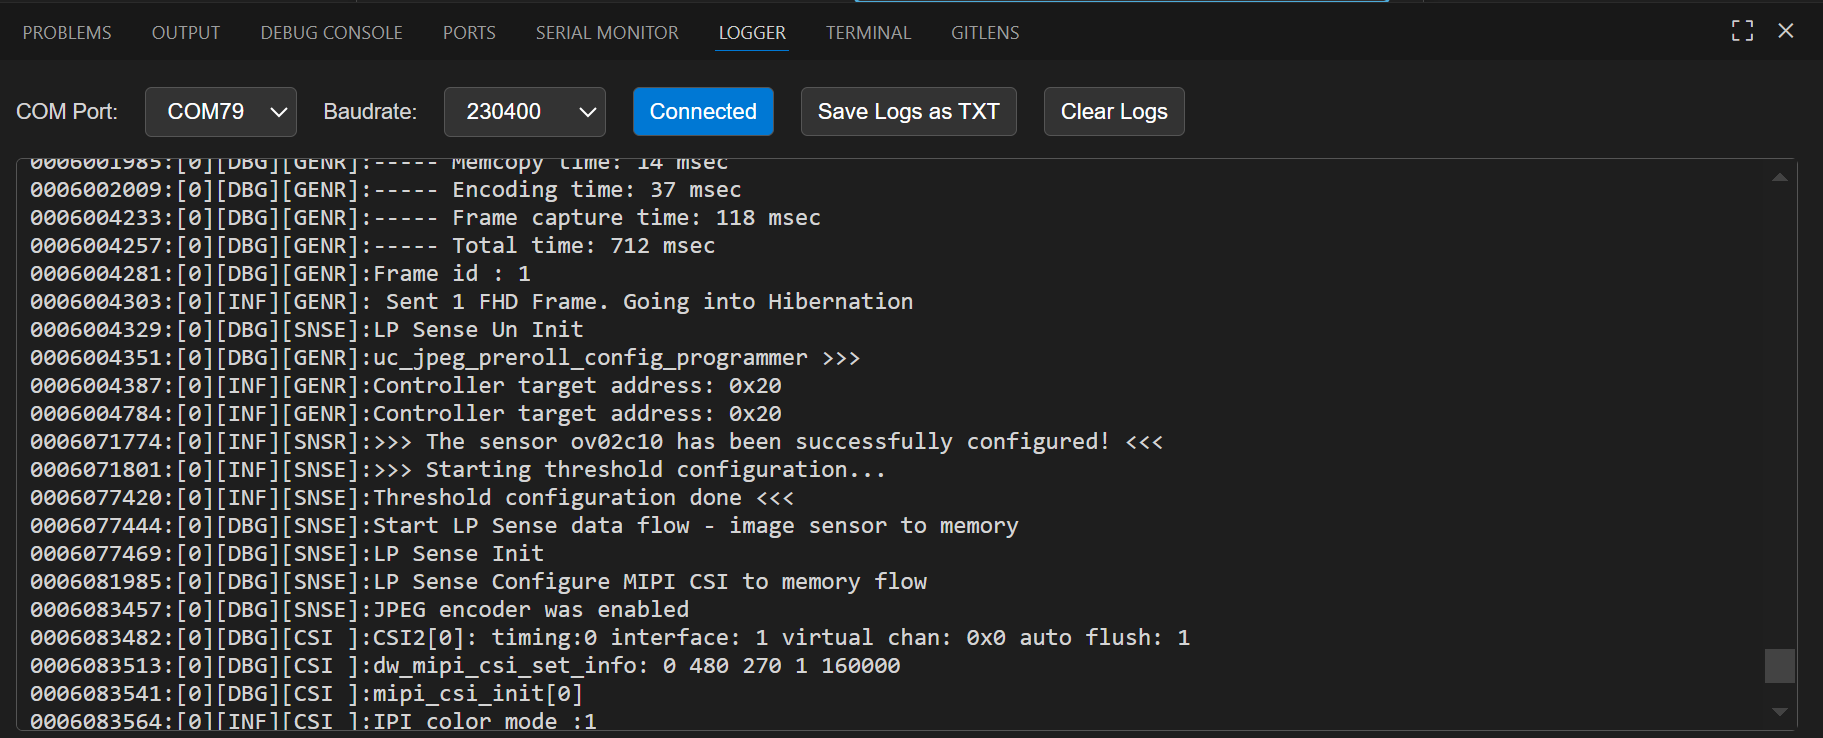
Logger
The ASTRA MCU Extension has a built in LOGGER tab to connect to the logger port and visualize the logs.
The logger utility is available in the default bottom panel of VS Code denoted as LOGGER.
Connect the logger port (UART/DAP logger), select the COM Port from the dropdown and click Connect. The logs will be displayed in the display area as shown below.
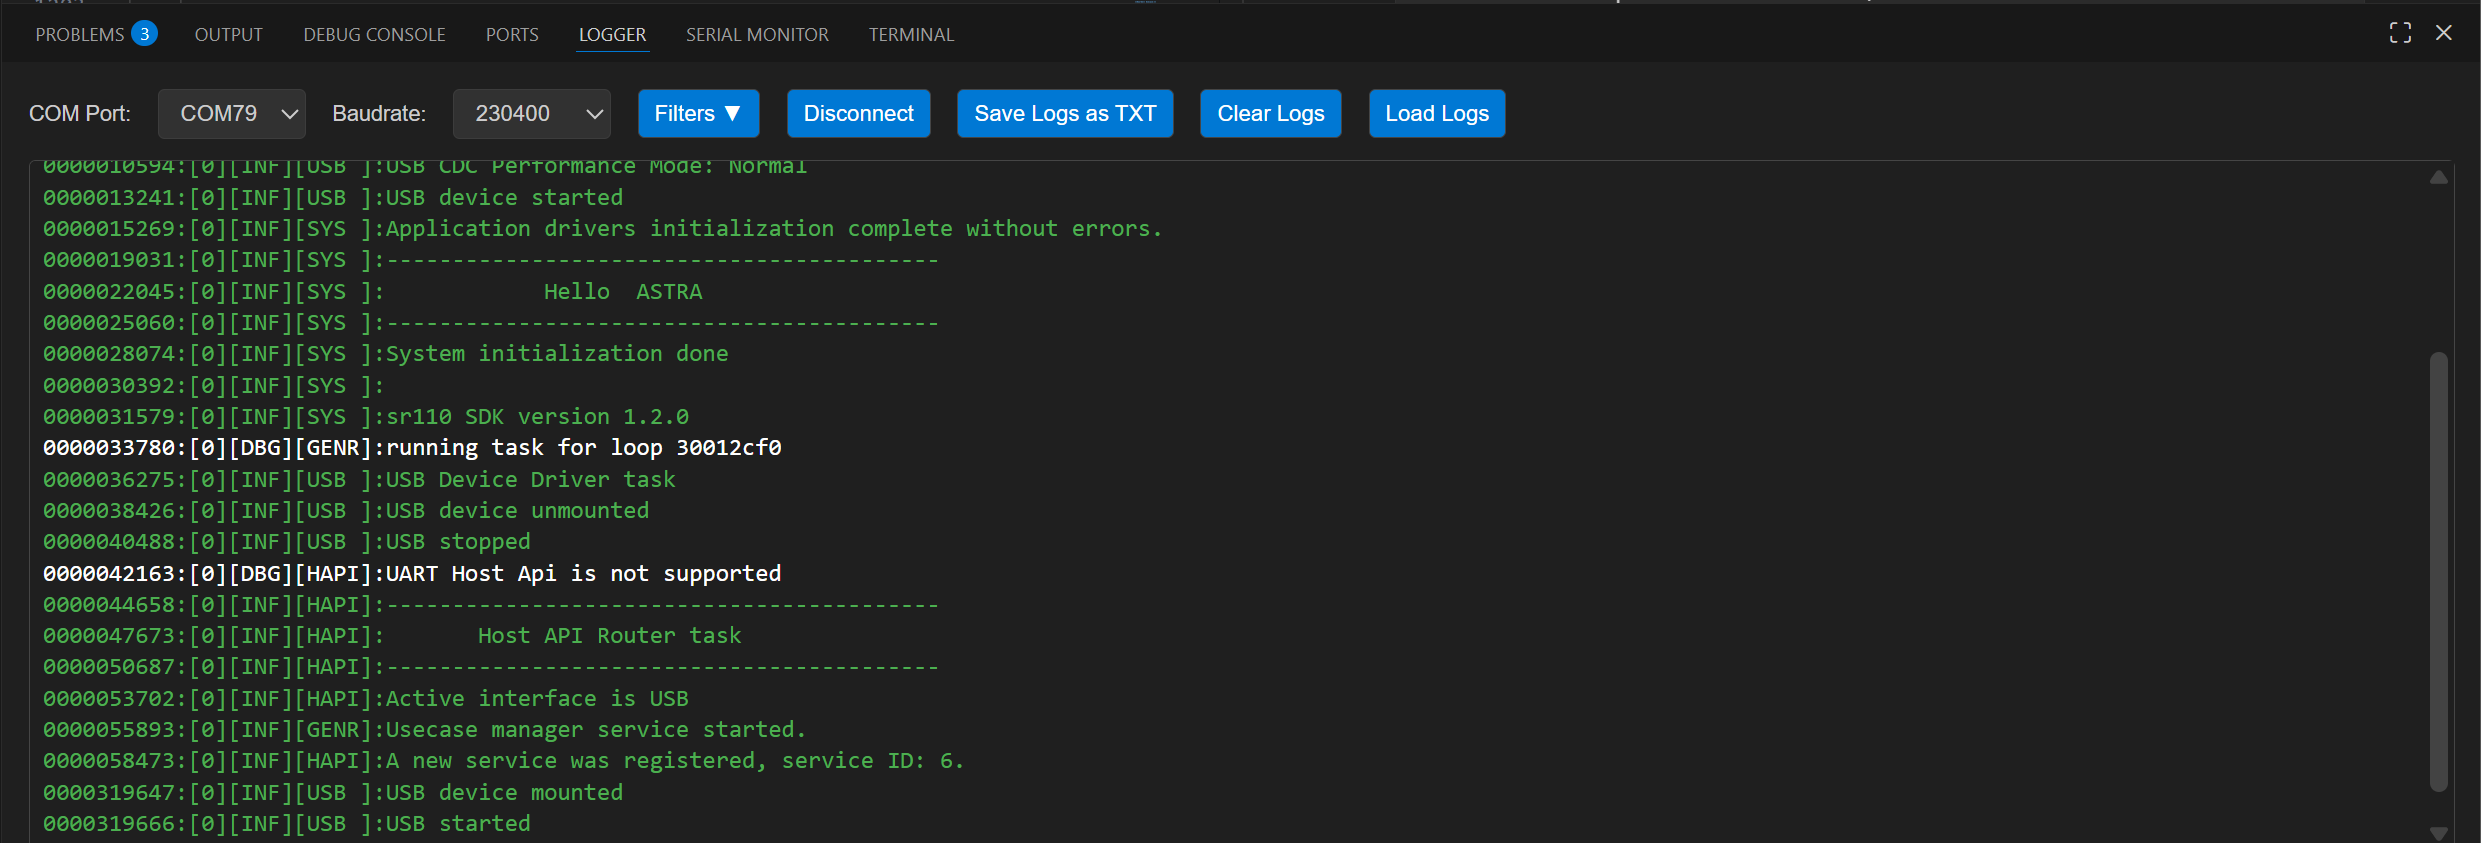
The logger now has utilities to save the ongoing log session and also load previously saved log files (which are in either .txt/.log format).
The logs are also color coded with respect to their log level, which would enhance the ease of use for the user.
Green - LOG_LEVEL_INFO
Red - LOG_LEVEL_ERROR
Yellow - LOG_LEVEL_WARN
White - LOG_LEVEL_DEBUG
Apart from this there is also a utility to filter out the logs based on the above mentioned log levels for easy filtering of relevant logs.
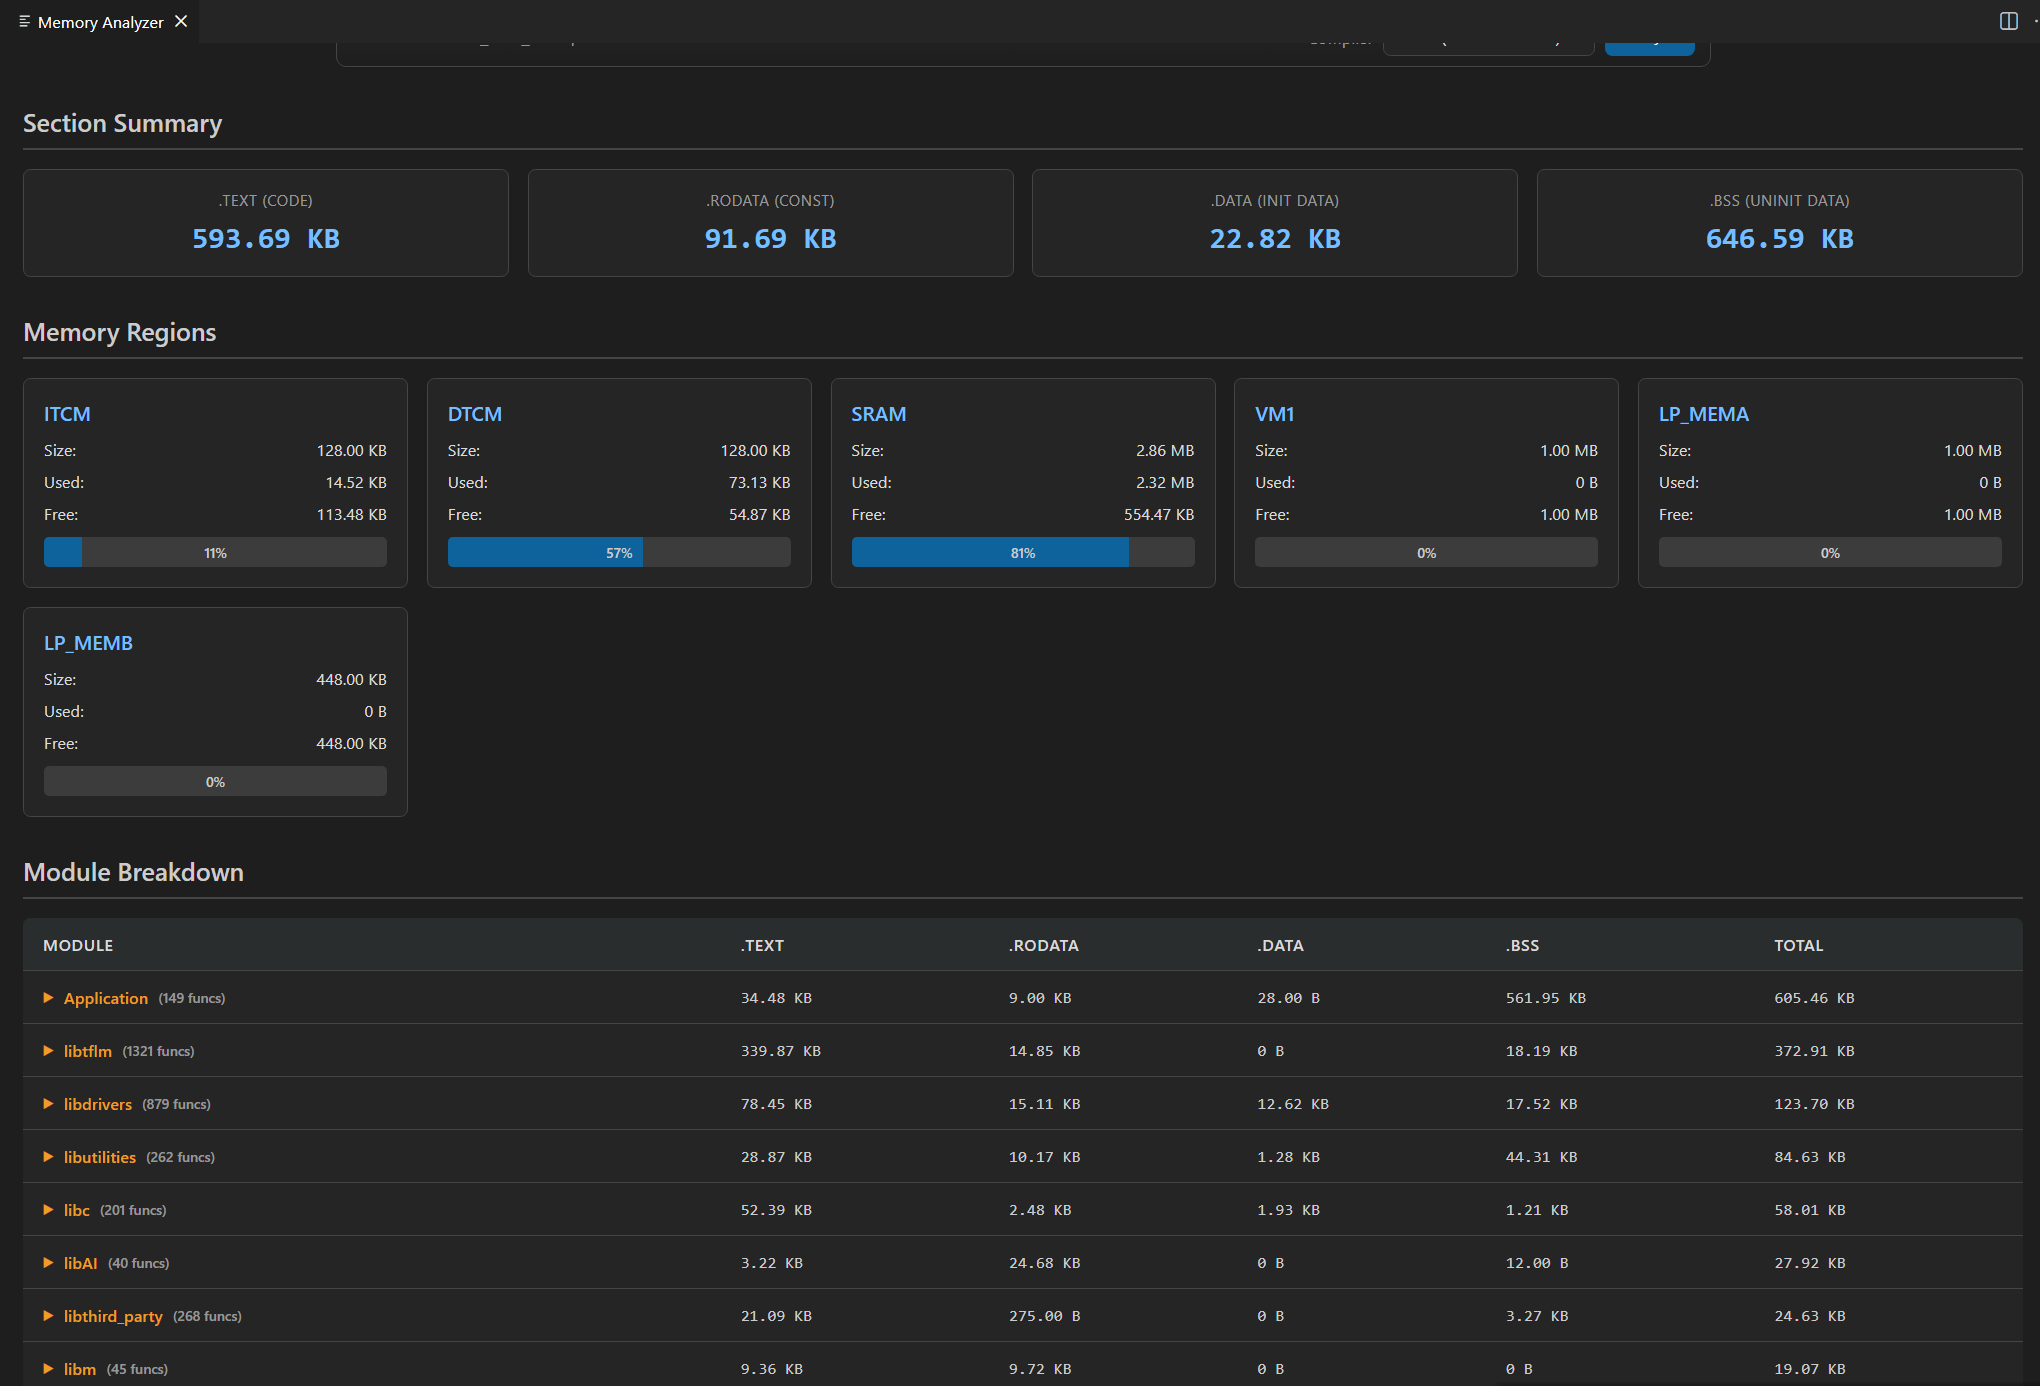
Memory Analyzer
Purpose:
The Memory Analyzer parses linker .map files and produces both summary and per-object analyses to help you understand flash and RAM usage. It is useful to find large symbols, inspect function-level code sizes, and generate reports for optimization.
What the analyzer reports:
Total code size (flash): Sum of
.textand related read-only sections.Total RW data (initialized RAM): Sum of
.datasizes.Total ZI data (uninitialized RAM / .bss): Sum of
.bsssizes.Total RAM usage: RW + ZI.
Top consumers chart: Visual top-10 object files by total size (code + RW + ZI).
Memory breakdown: Section-level view (Code, Const/ROData, RW, ZI) with simple Stack/Heap estimates shown in the UI.
Detailed object analysis: Per-object cards showing
codeSize,rwDataSize,ziDataSize, total size, and a list of discovered functions with individual sizes.
Pre-requisites:
A linker
.mapfile from a build (common location:examples/build/<target>/<compiler>/<target>.map).
Supported compilers & parsing behaviour:
The analyzer understands GCC-style , AC6-style or LLVM-style map file layouts and exposes a
Compilerselector (GCC/AC6/LLVM) in the UI. If the parser cannot find expected sections, the extension shows a warning and displays sample fallback data to demonstrate the UI.
How to use the UI:
Open the Memory Analyzer panel from the Synaptics extension sidebar.
Drag & drop a
.mapfile into the upload area or useBrowseto choose the file.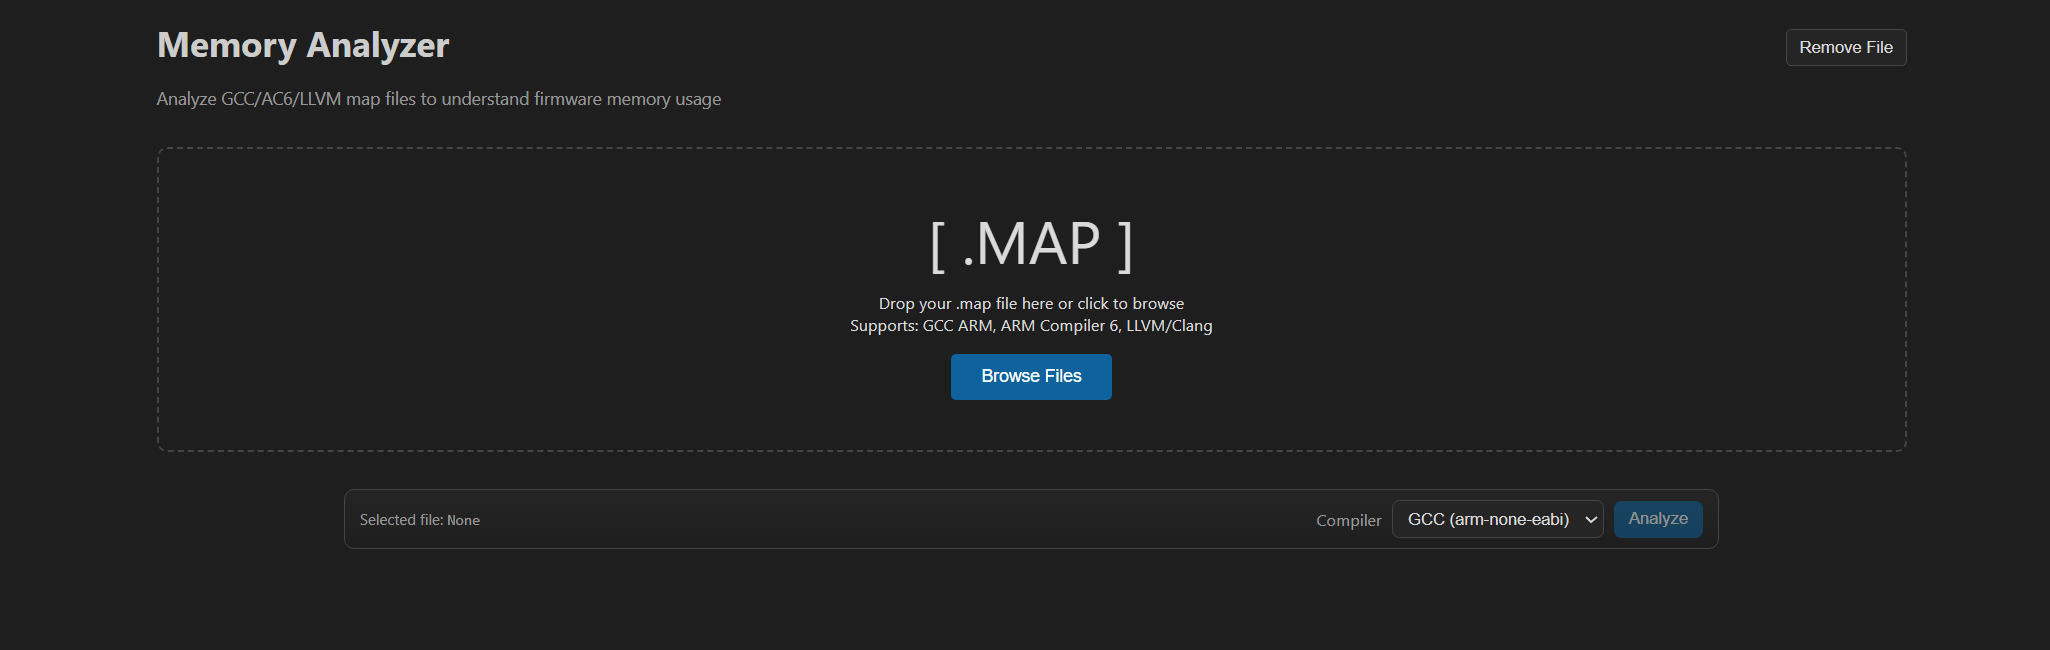
Select the compiler type in the dropdown (GCC/AC6/LLVM) and click
Analyze Memory.Wait for the loader; once complete the Memory Summary and Detailed Object Analysis panels appear.
Use the search box to filter objects/functions, change
Sort byto reorder, and use pagination controls to navigate large result sets.
Debugging UI
This section covers generic debugging UI features available in the extension. For step-by-step setup and build/flash prerequisites, see
Download and Reset Program
Pre-requisites:
Install the following extensions using the “Astra SDK Tools Installer” tab:
C/C++ IntelliSense, debugging, and code browsing extension in VS Code.
MemoryView extension to view the memory map while debugging.
Serial Monitor extension for viewing logs while debugging.
Memory Inspector CDT extension by Eclipse IDE.
Import an Astra MCU SDK before debugging.
Ensure the debug probe and the target device are properly connected.
Steps:
In the Build and Deploy webview, select the Debug Options panel.
For a unified workflow, open Build Configurations, choose Debug under BuildType, and enable Debug Options.
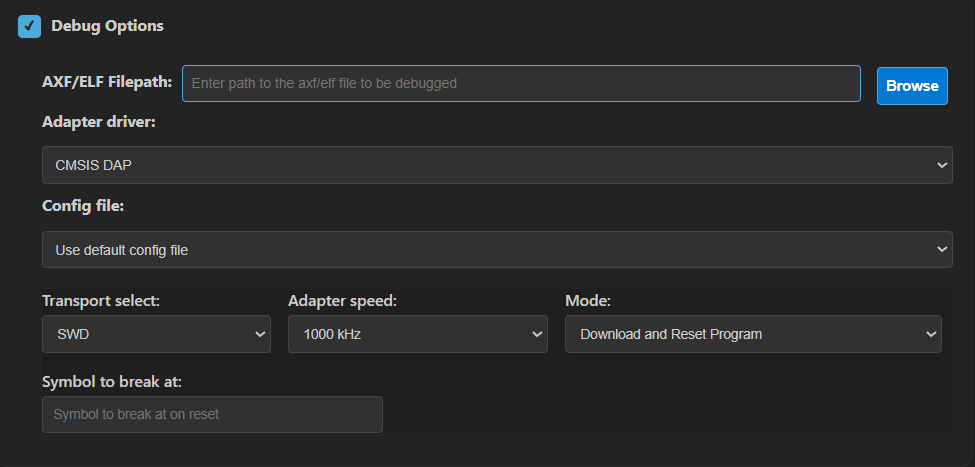
In Debug Options, select the AXF/ELF path (auto-populated if a debug build completed).
Choose the probe, transport, and speed settings appropriate for your setup.
Choose a default or custom config file. Default config files are under
tools/openocd/configs/.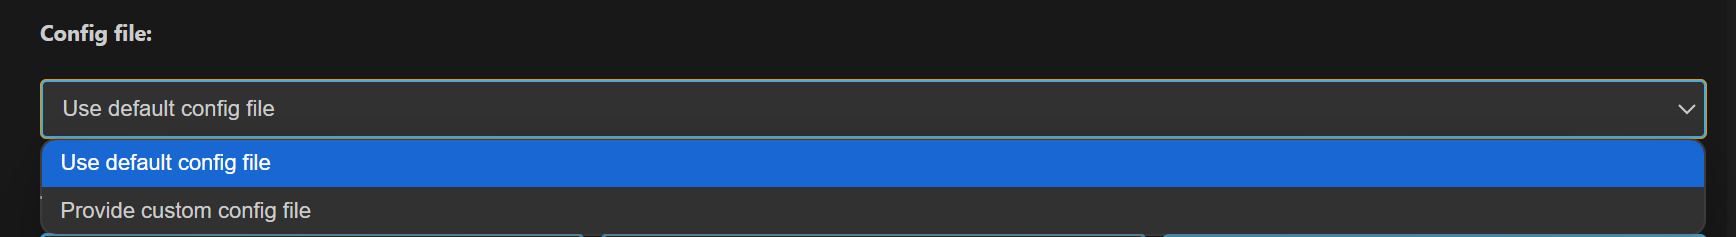
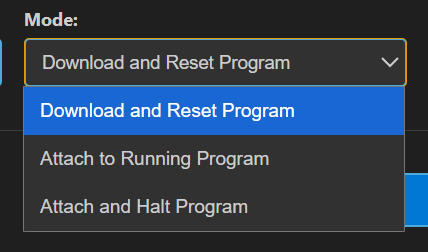
Select a debug mode: Download and Reset Program, Attach to Running Program, or Attach and Halt Program.

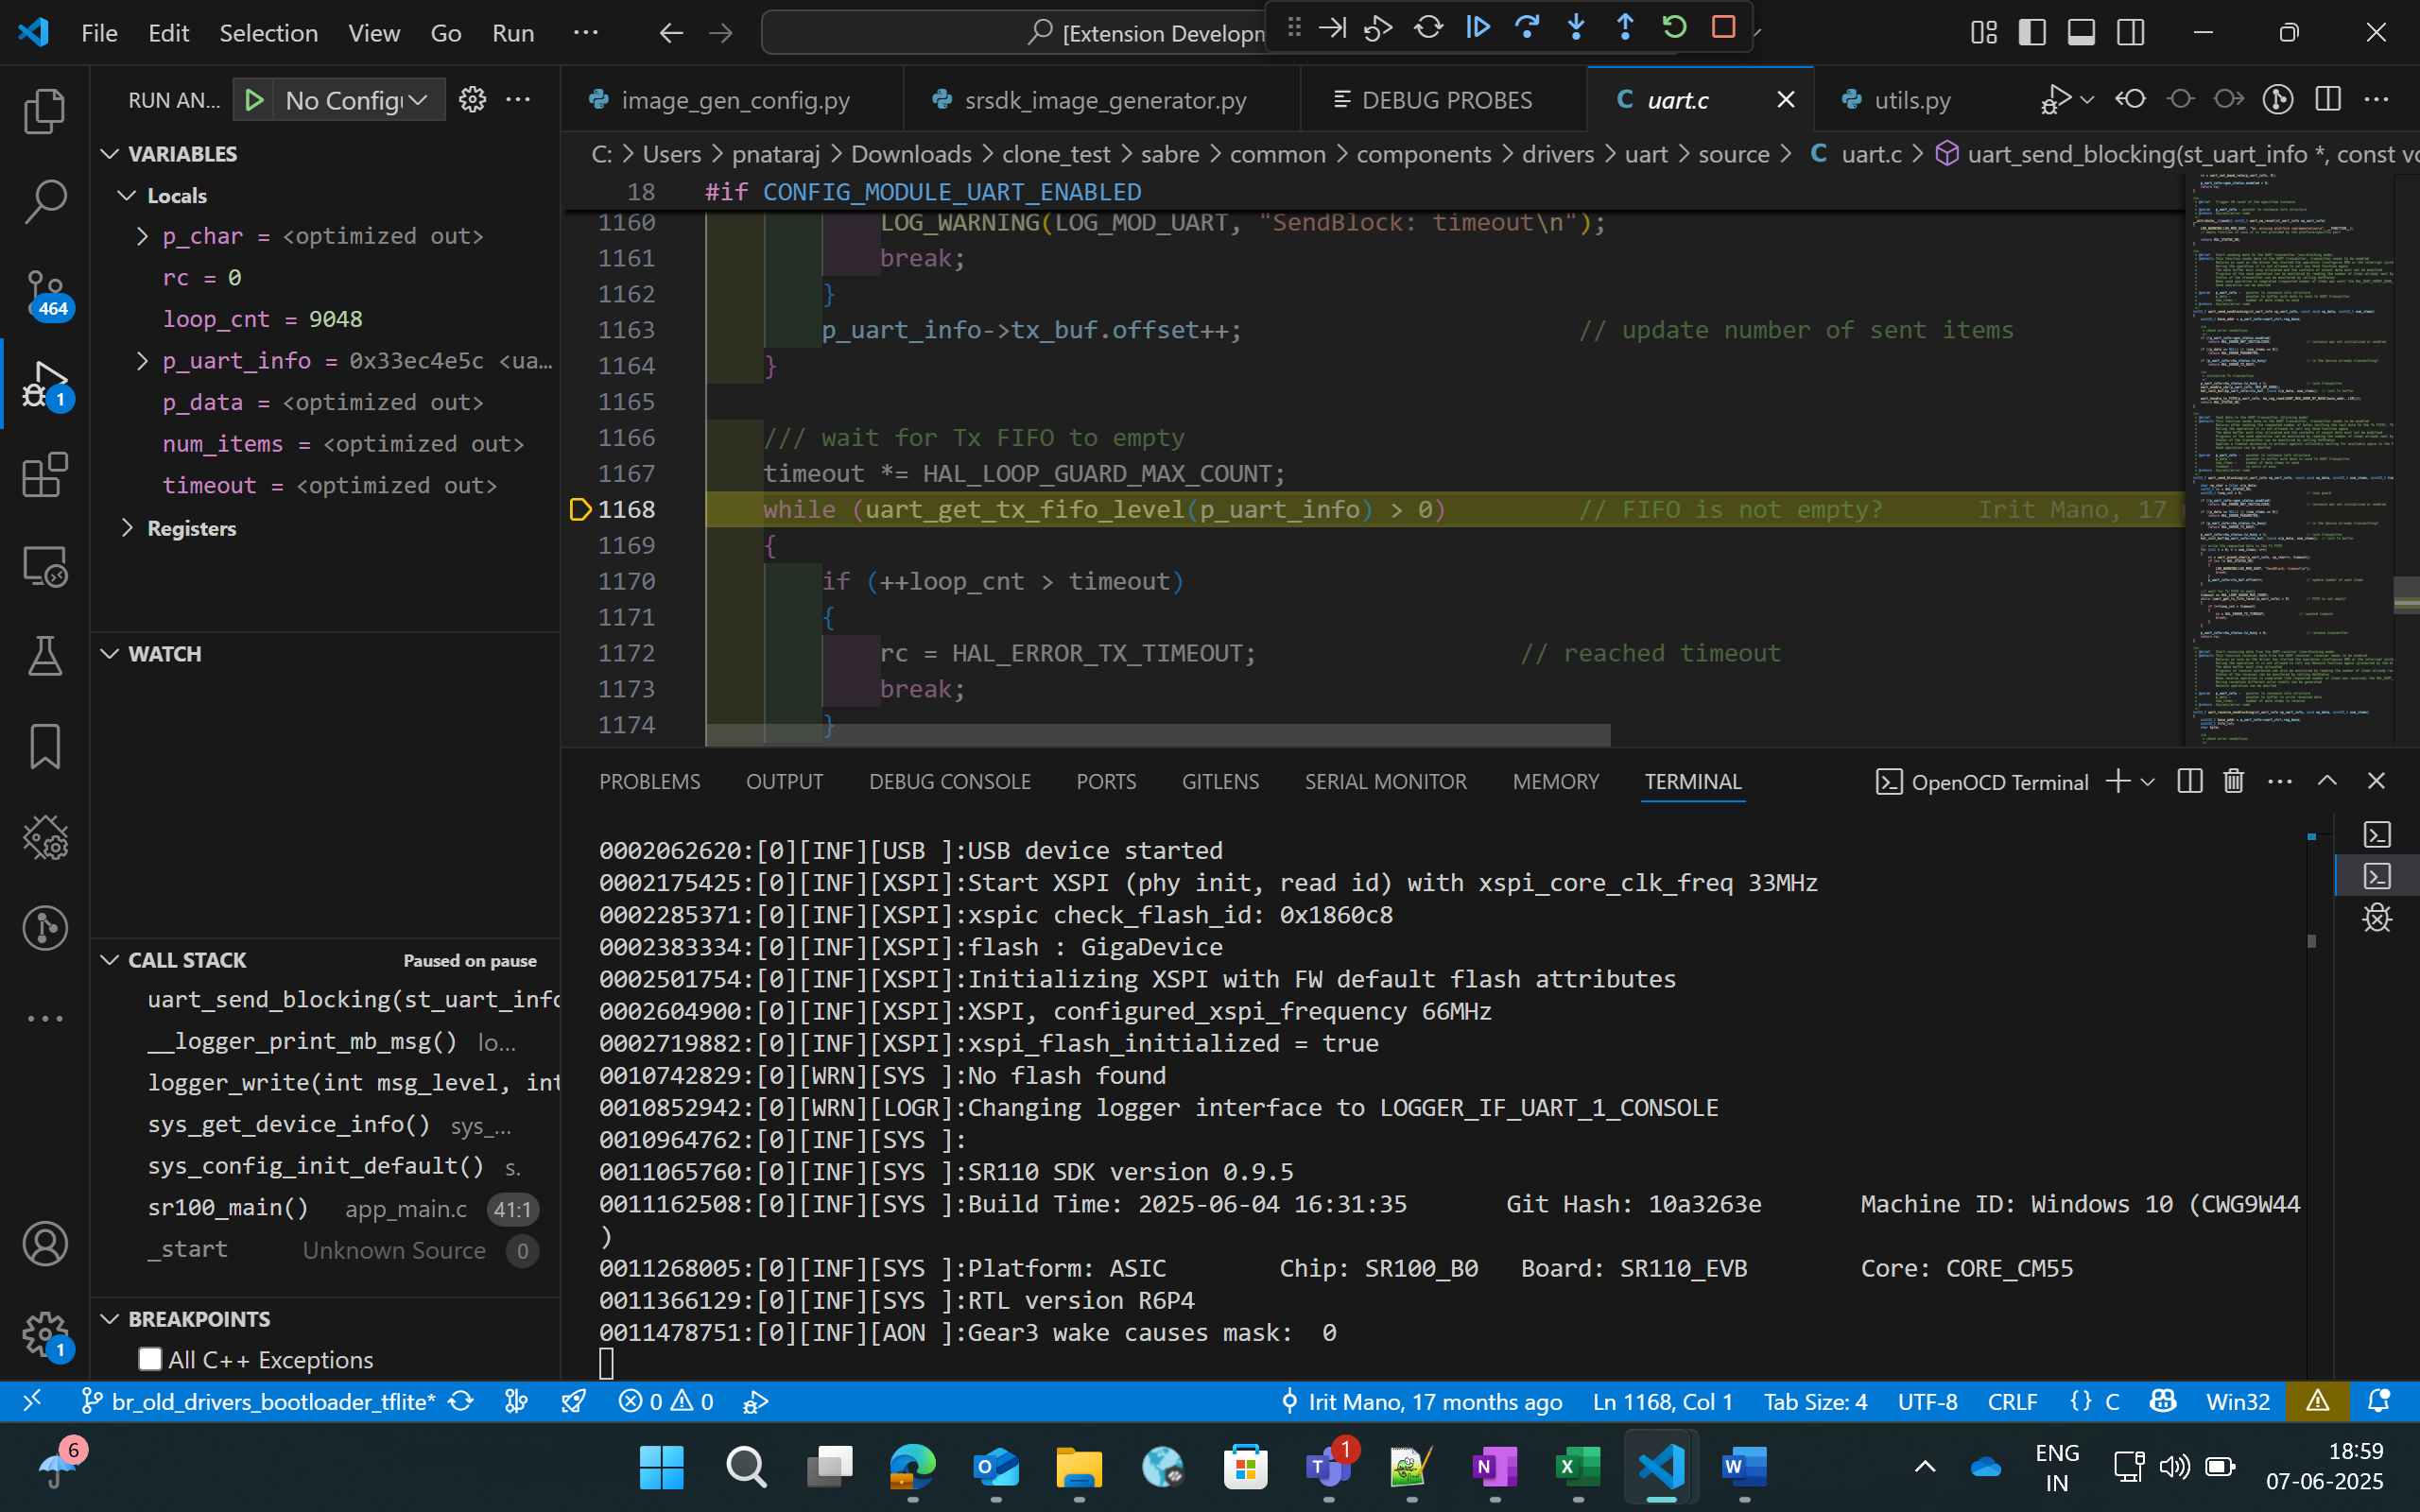
Click Run to start debugging. OpenOCD and GDB will start in separate terminals.
Once connected, the debugger pauses at
main.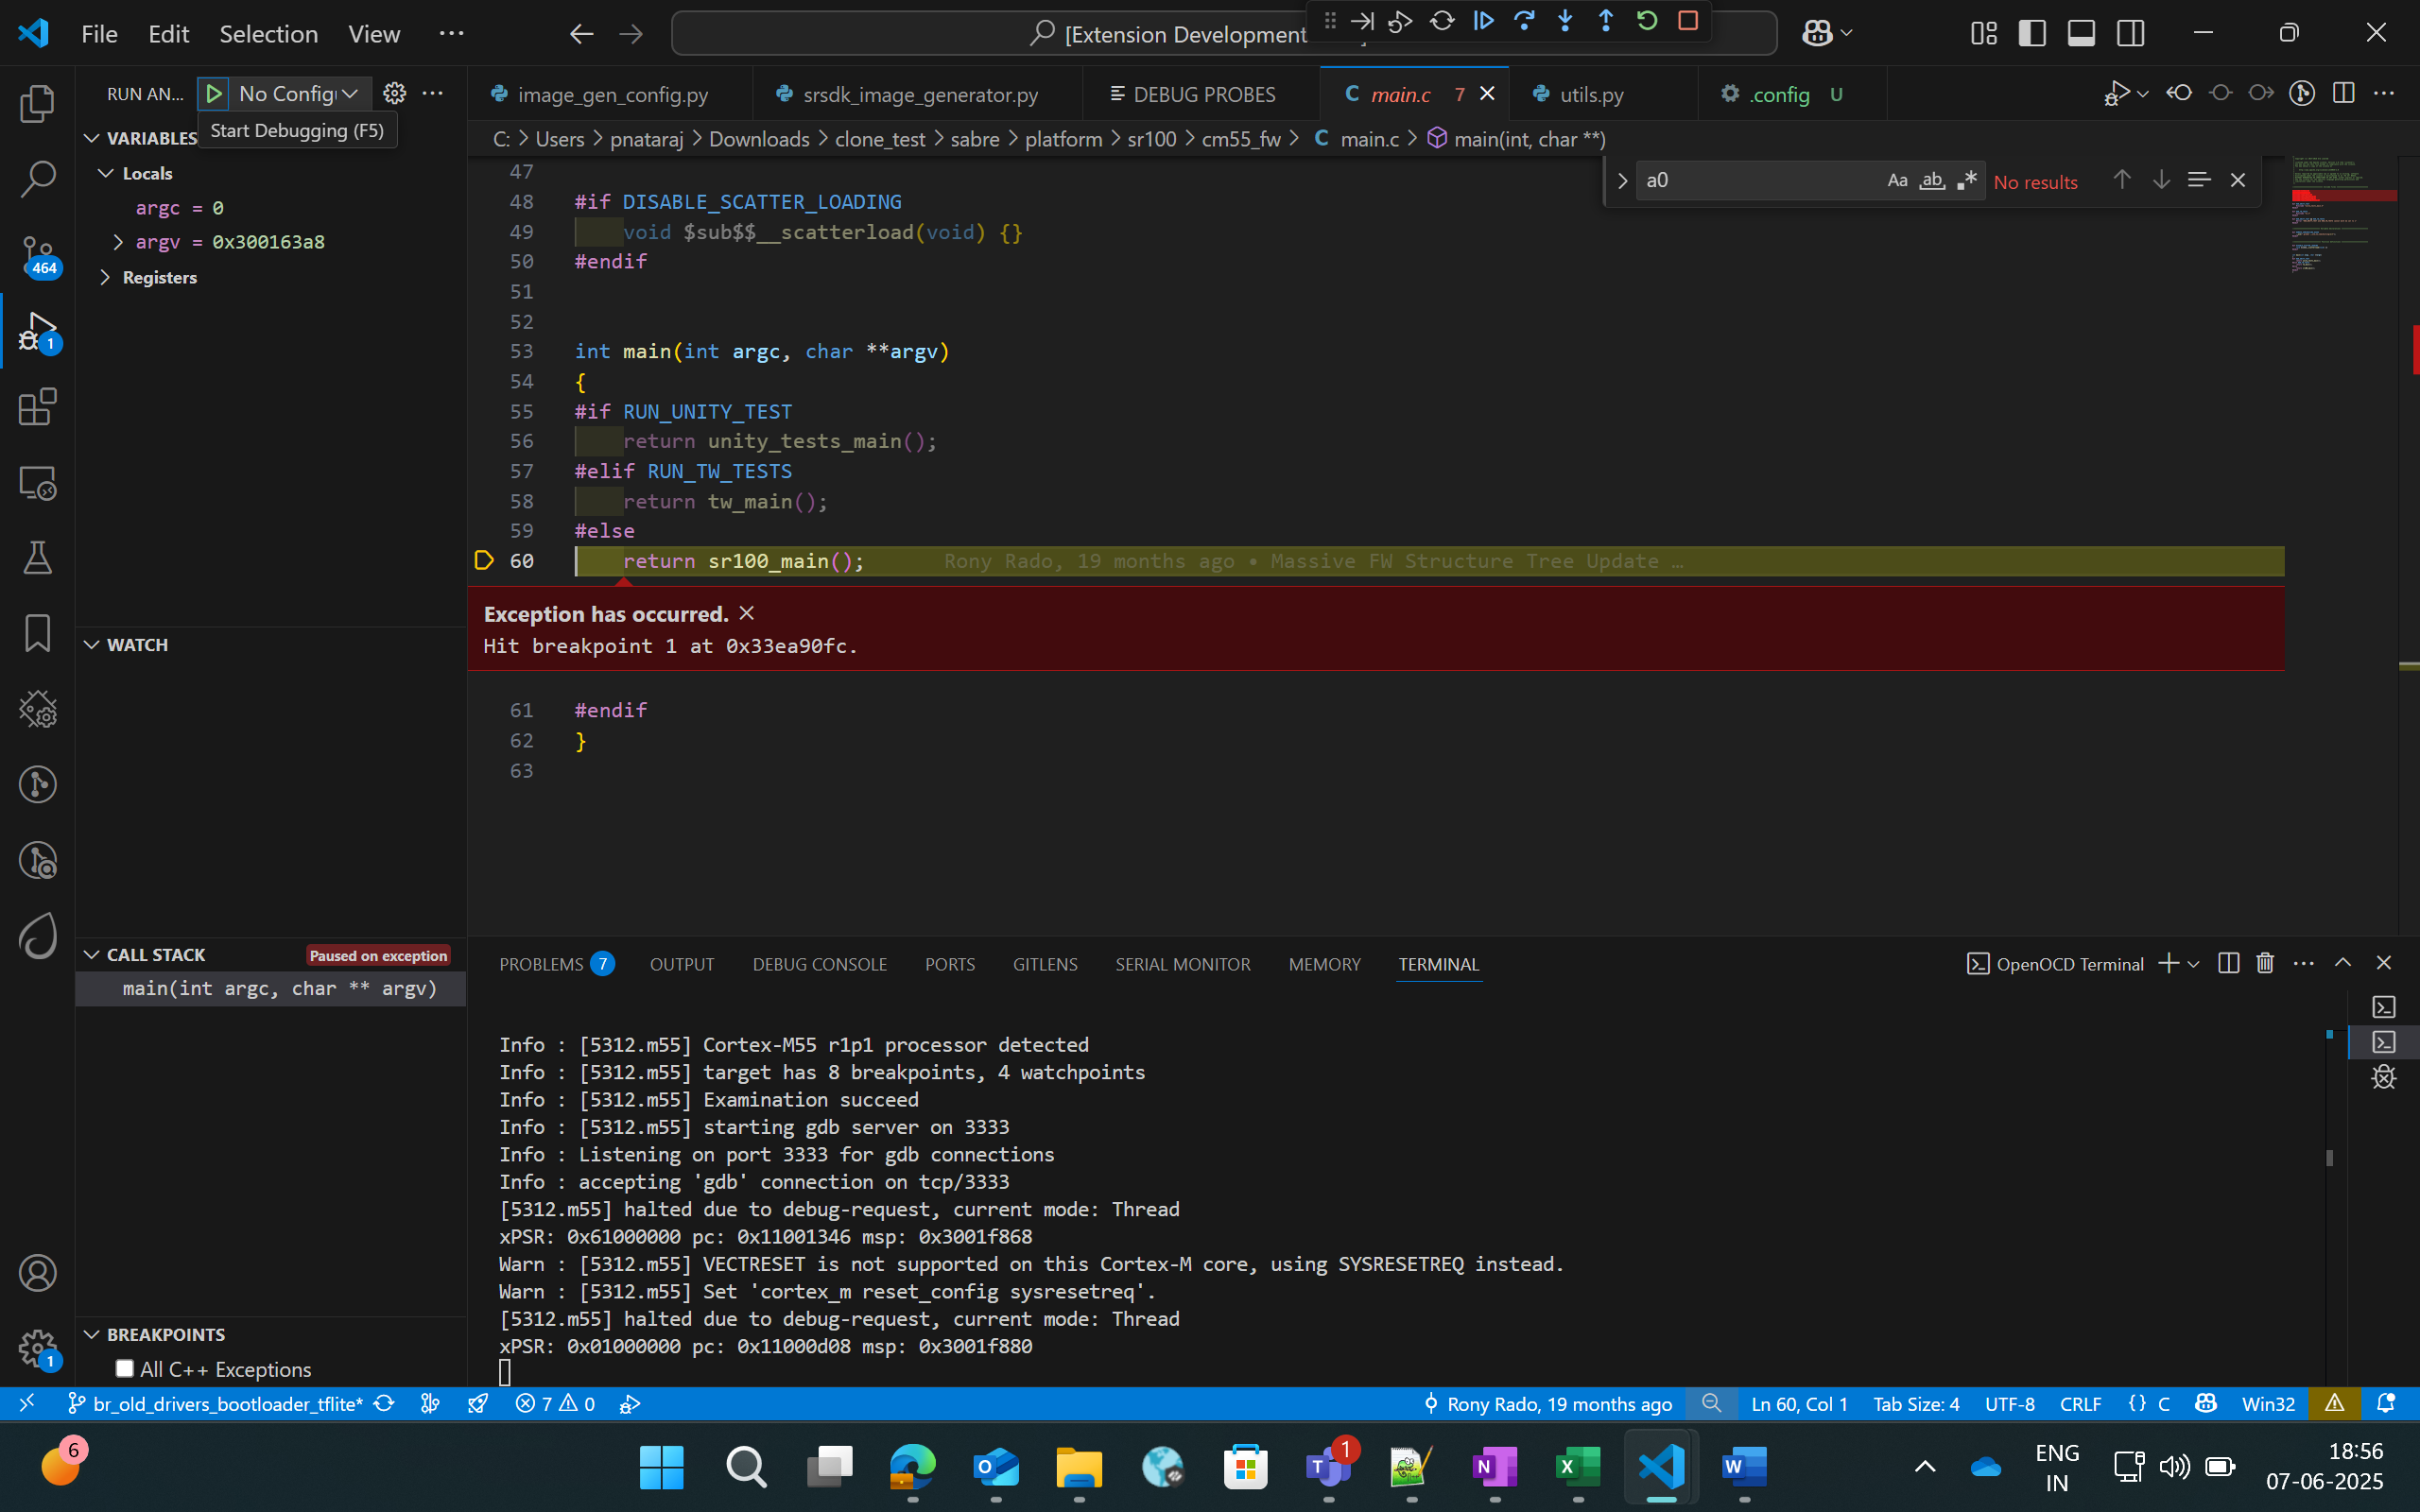
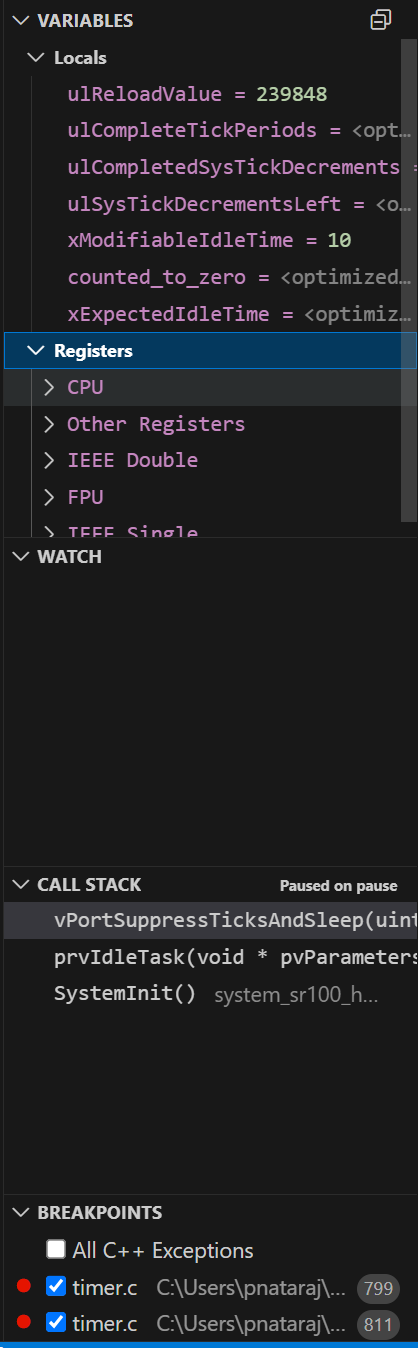
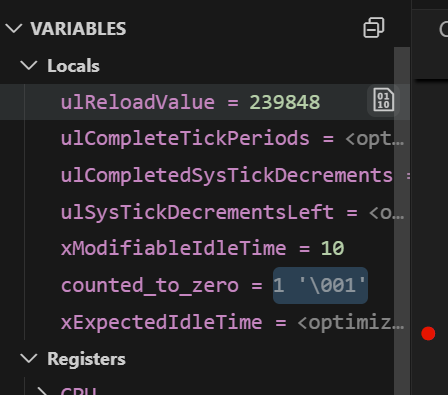
Use the Debug sidebar to view variables, call stack, registers, and breakpoints.
Global Variables
Purpose: View global variables and values in a dedicated panel.
Steps:
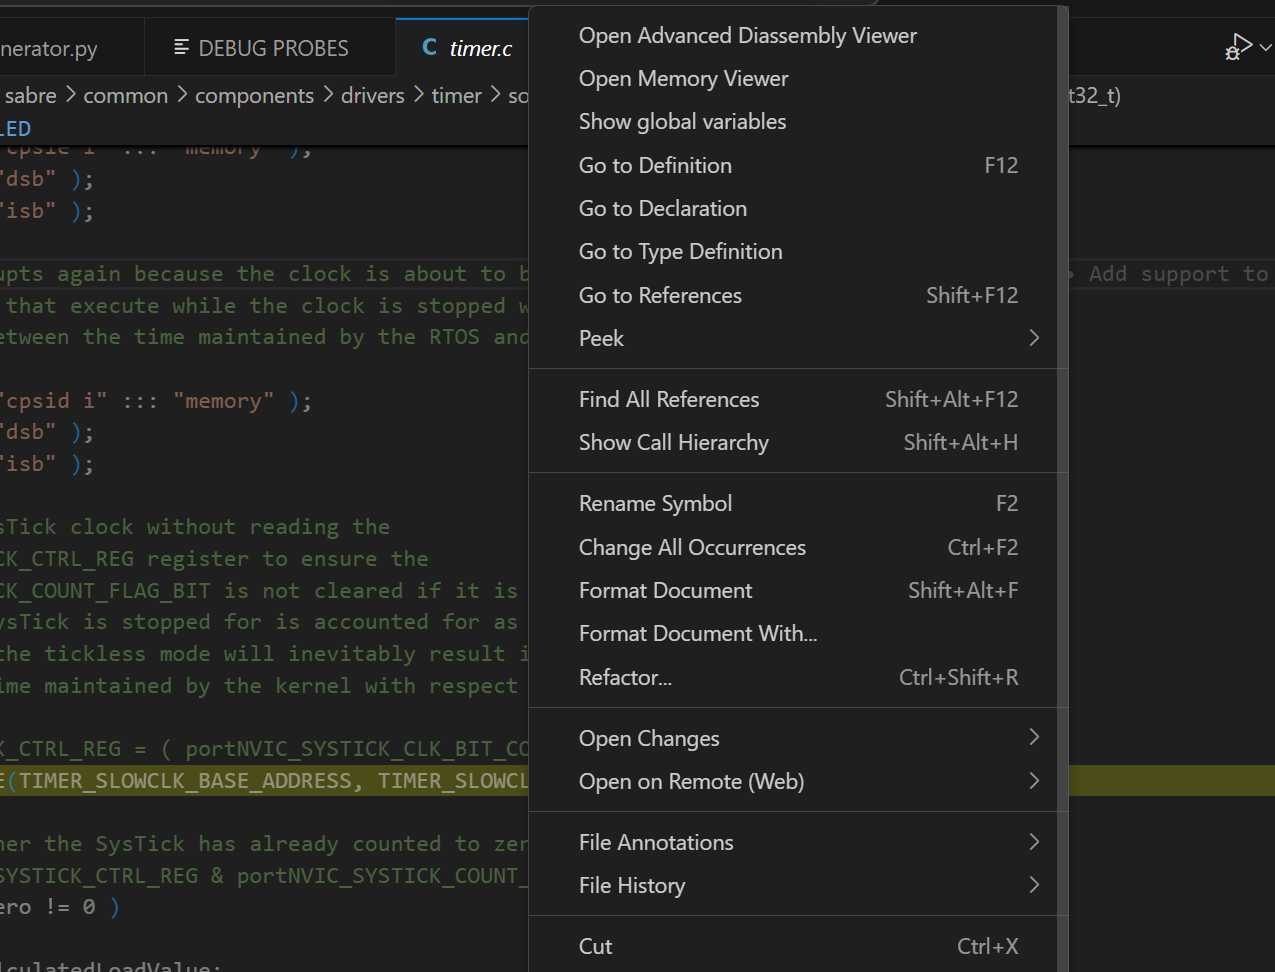
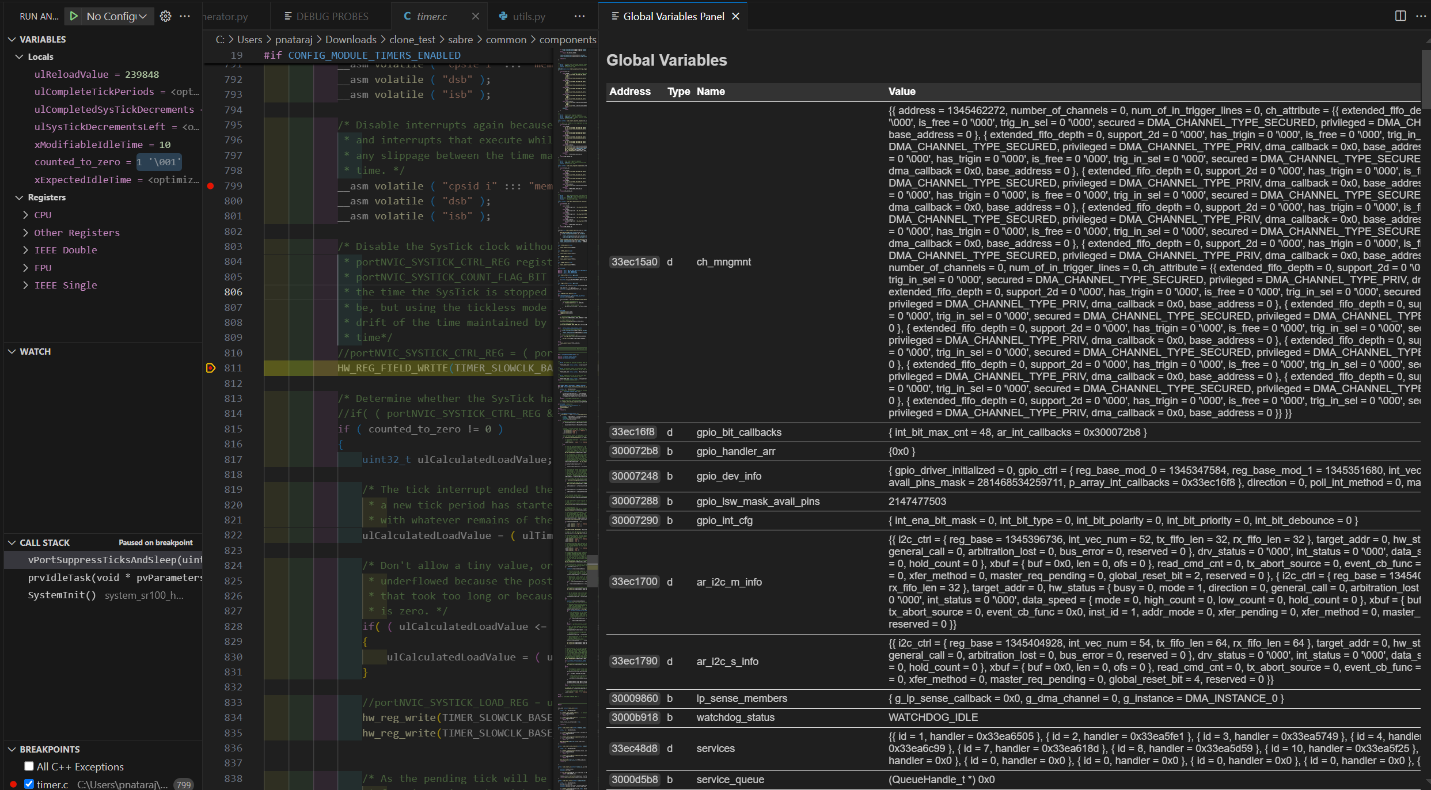
Right-click in the editor and select Show Global Variables.
The panel lists global variables, addresses, types, and values. It refreshes when the debugger pauses.
Debug Toolbar
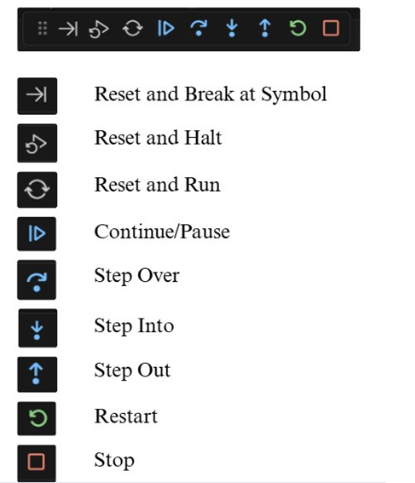
Once a debug session starts, the toolbar provides common controls.
Reset options:
Option |
Description |
|---|---|
Reset and Break at Symbol |
Reset and stop at a specific symbol you enter. |
Reset and Halt |
Reset and halt at |
Reset and Run |
Reset and run without stopping. |
Other options:
Continue/Pause: Continue or pause execution. On Linux/macOS, use the custom pause button if needed.
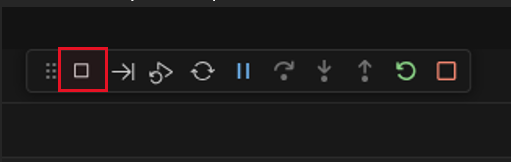
Step Over, Step Into, Step Out
Restart: Restart debug session at the same entry point.
Stop: End the debug session.
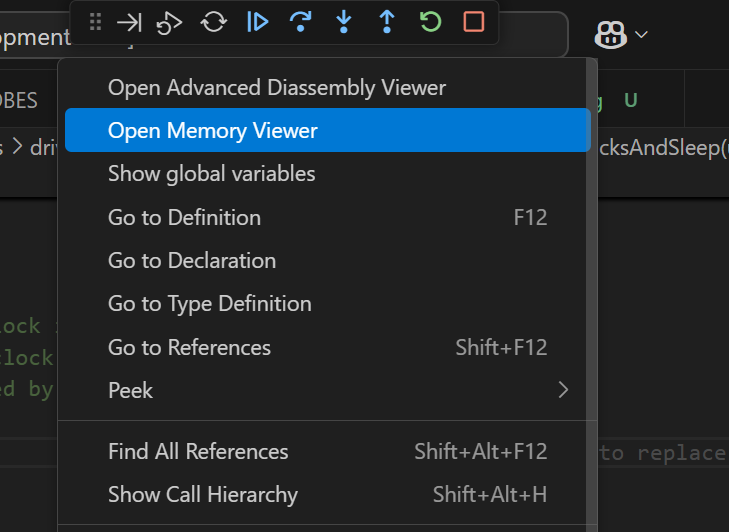
Memory Inspection and Manipulation
Right-click a variable and select View Binary Data to open a memory view.
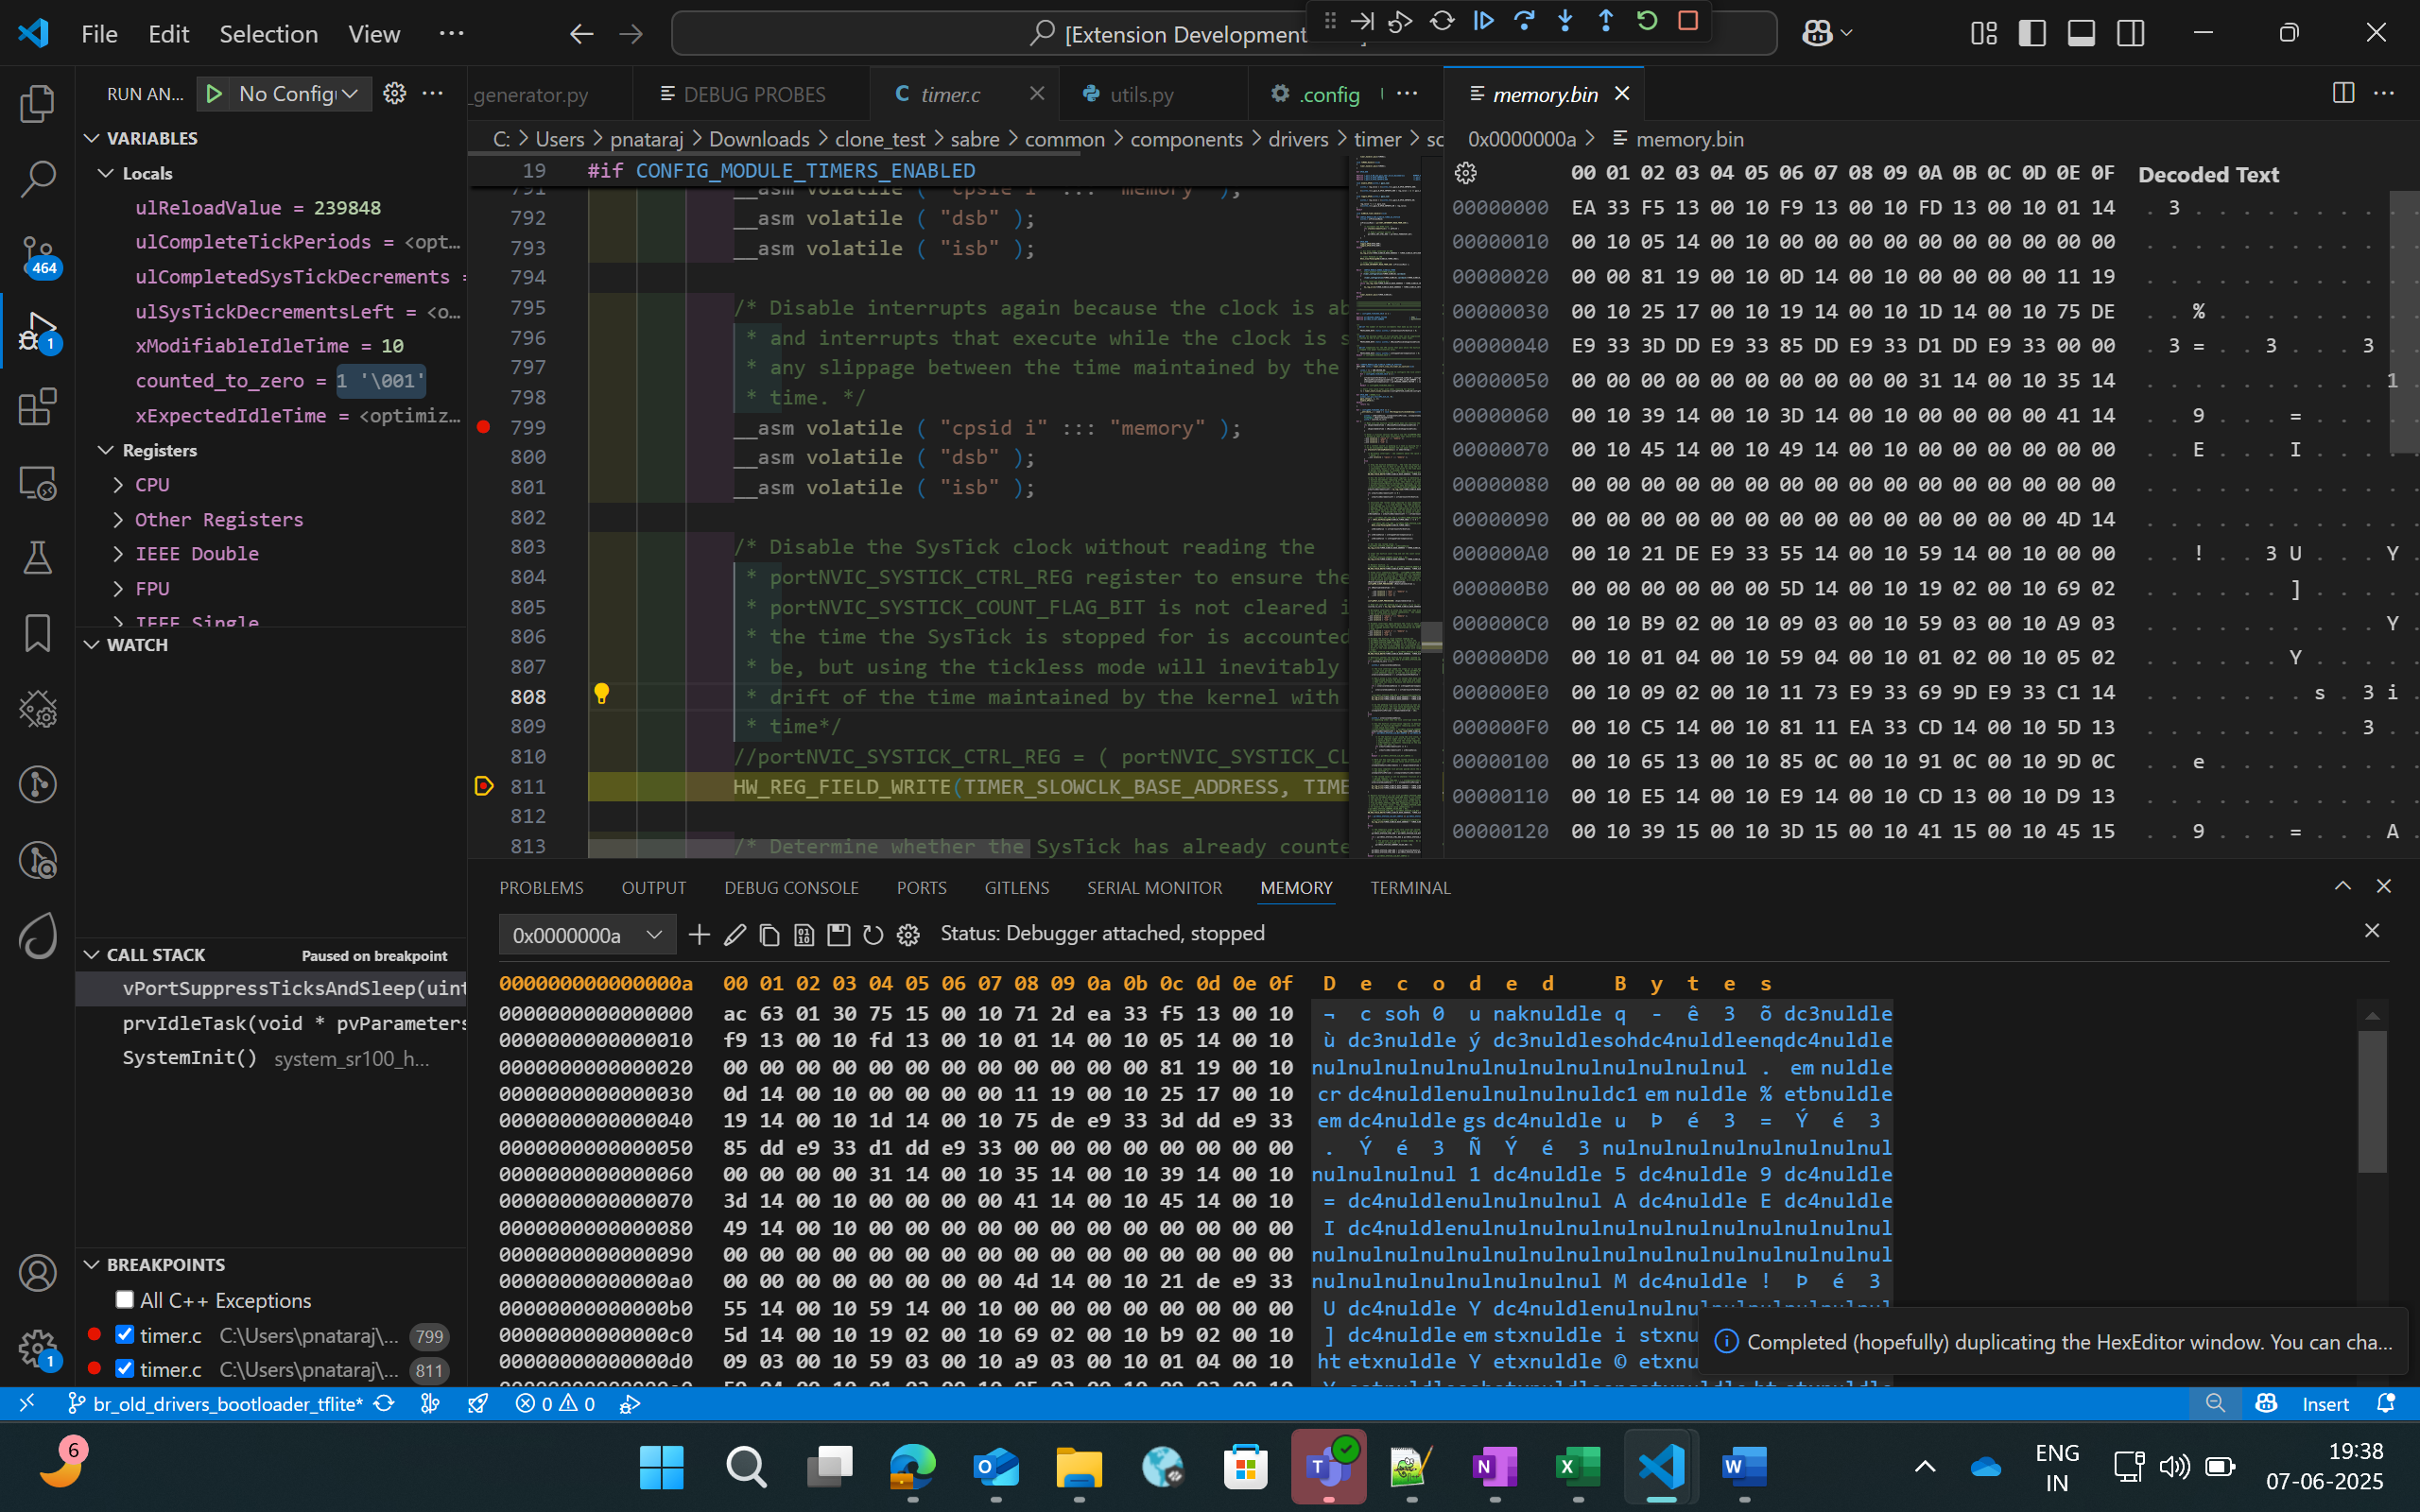
Right-click in the editor and select Open Memory Viewer for a split view with edit/fill controls.
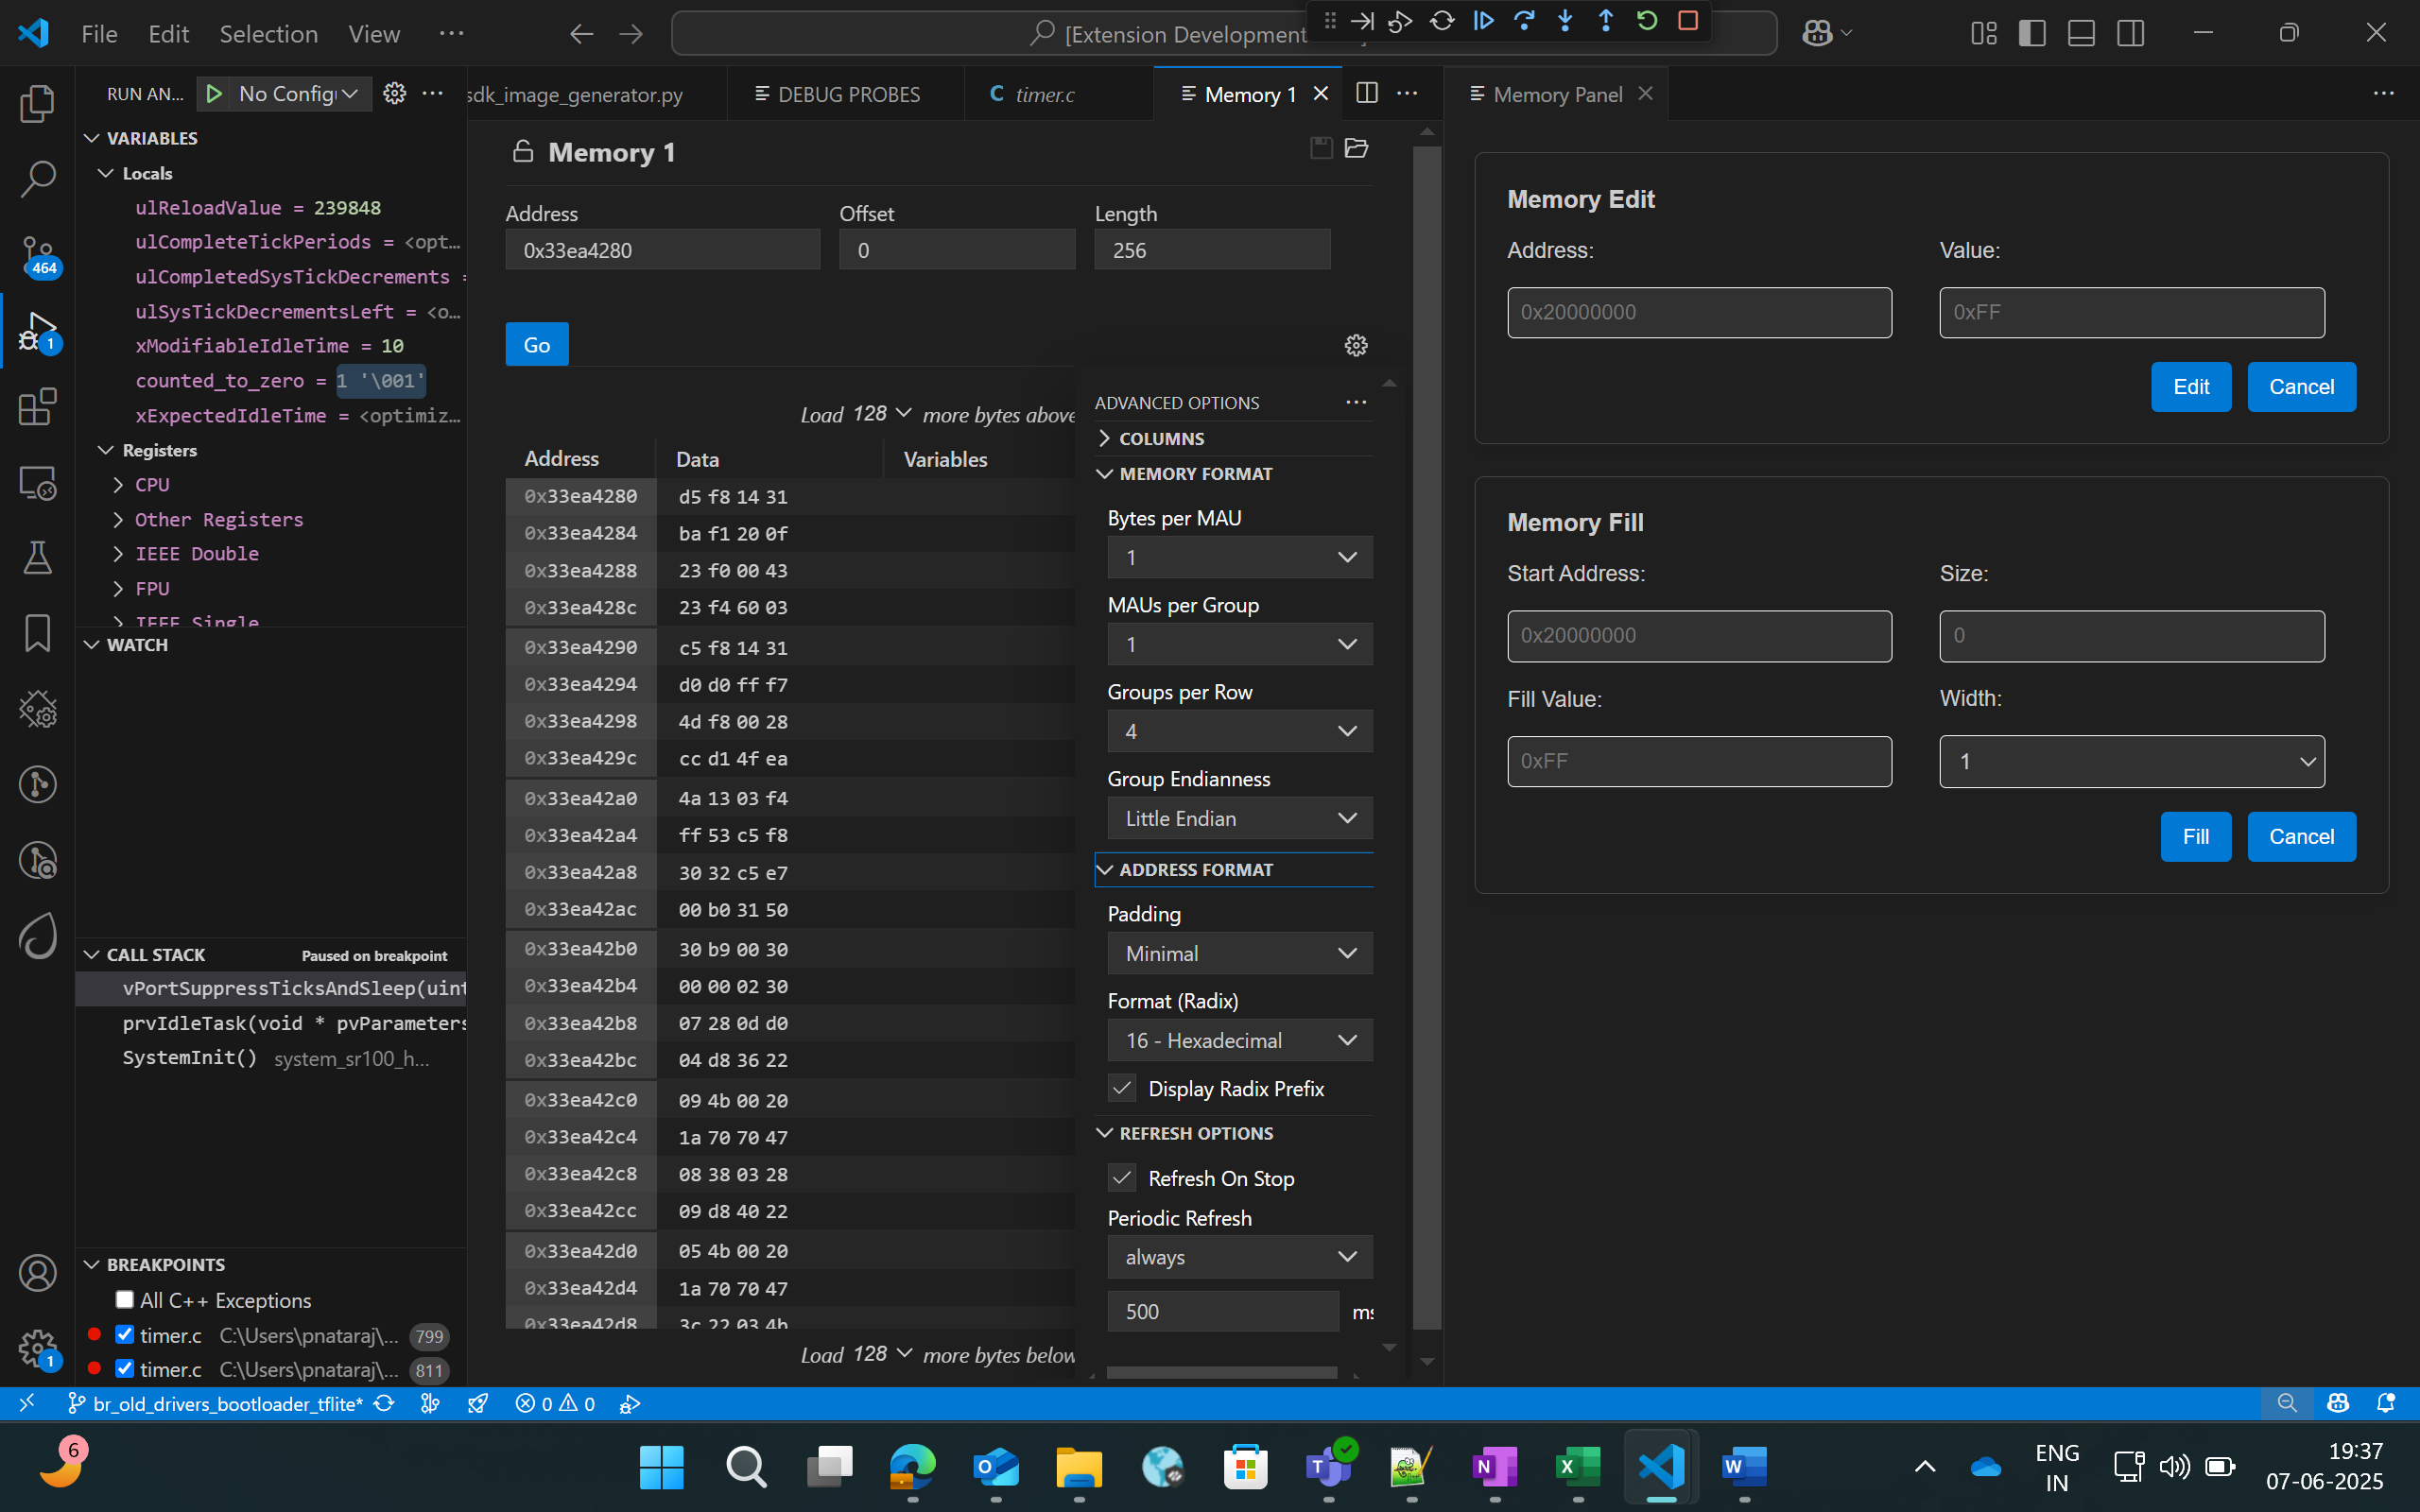
The left panel supports multiple formats, periodic refresh, and configurable display.
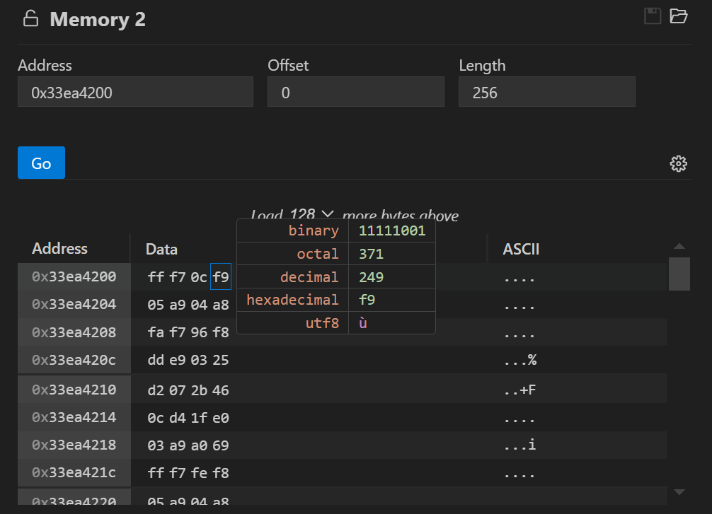
The right panel supports Memory Edit and Memory Fill operations.
Note: The fill value must fit the selected width. If shorter, it is padded with zeros.
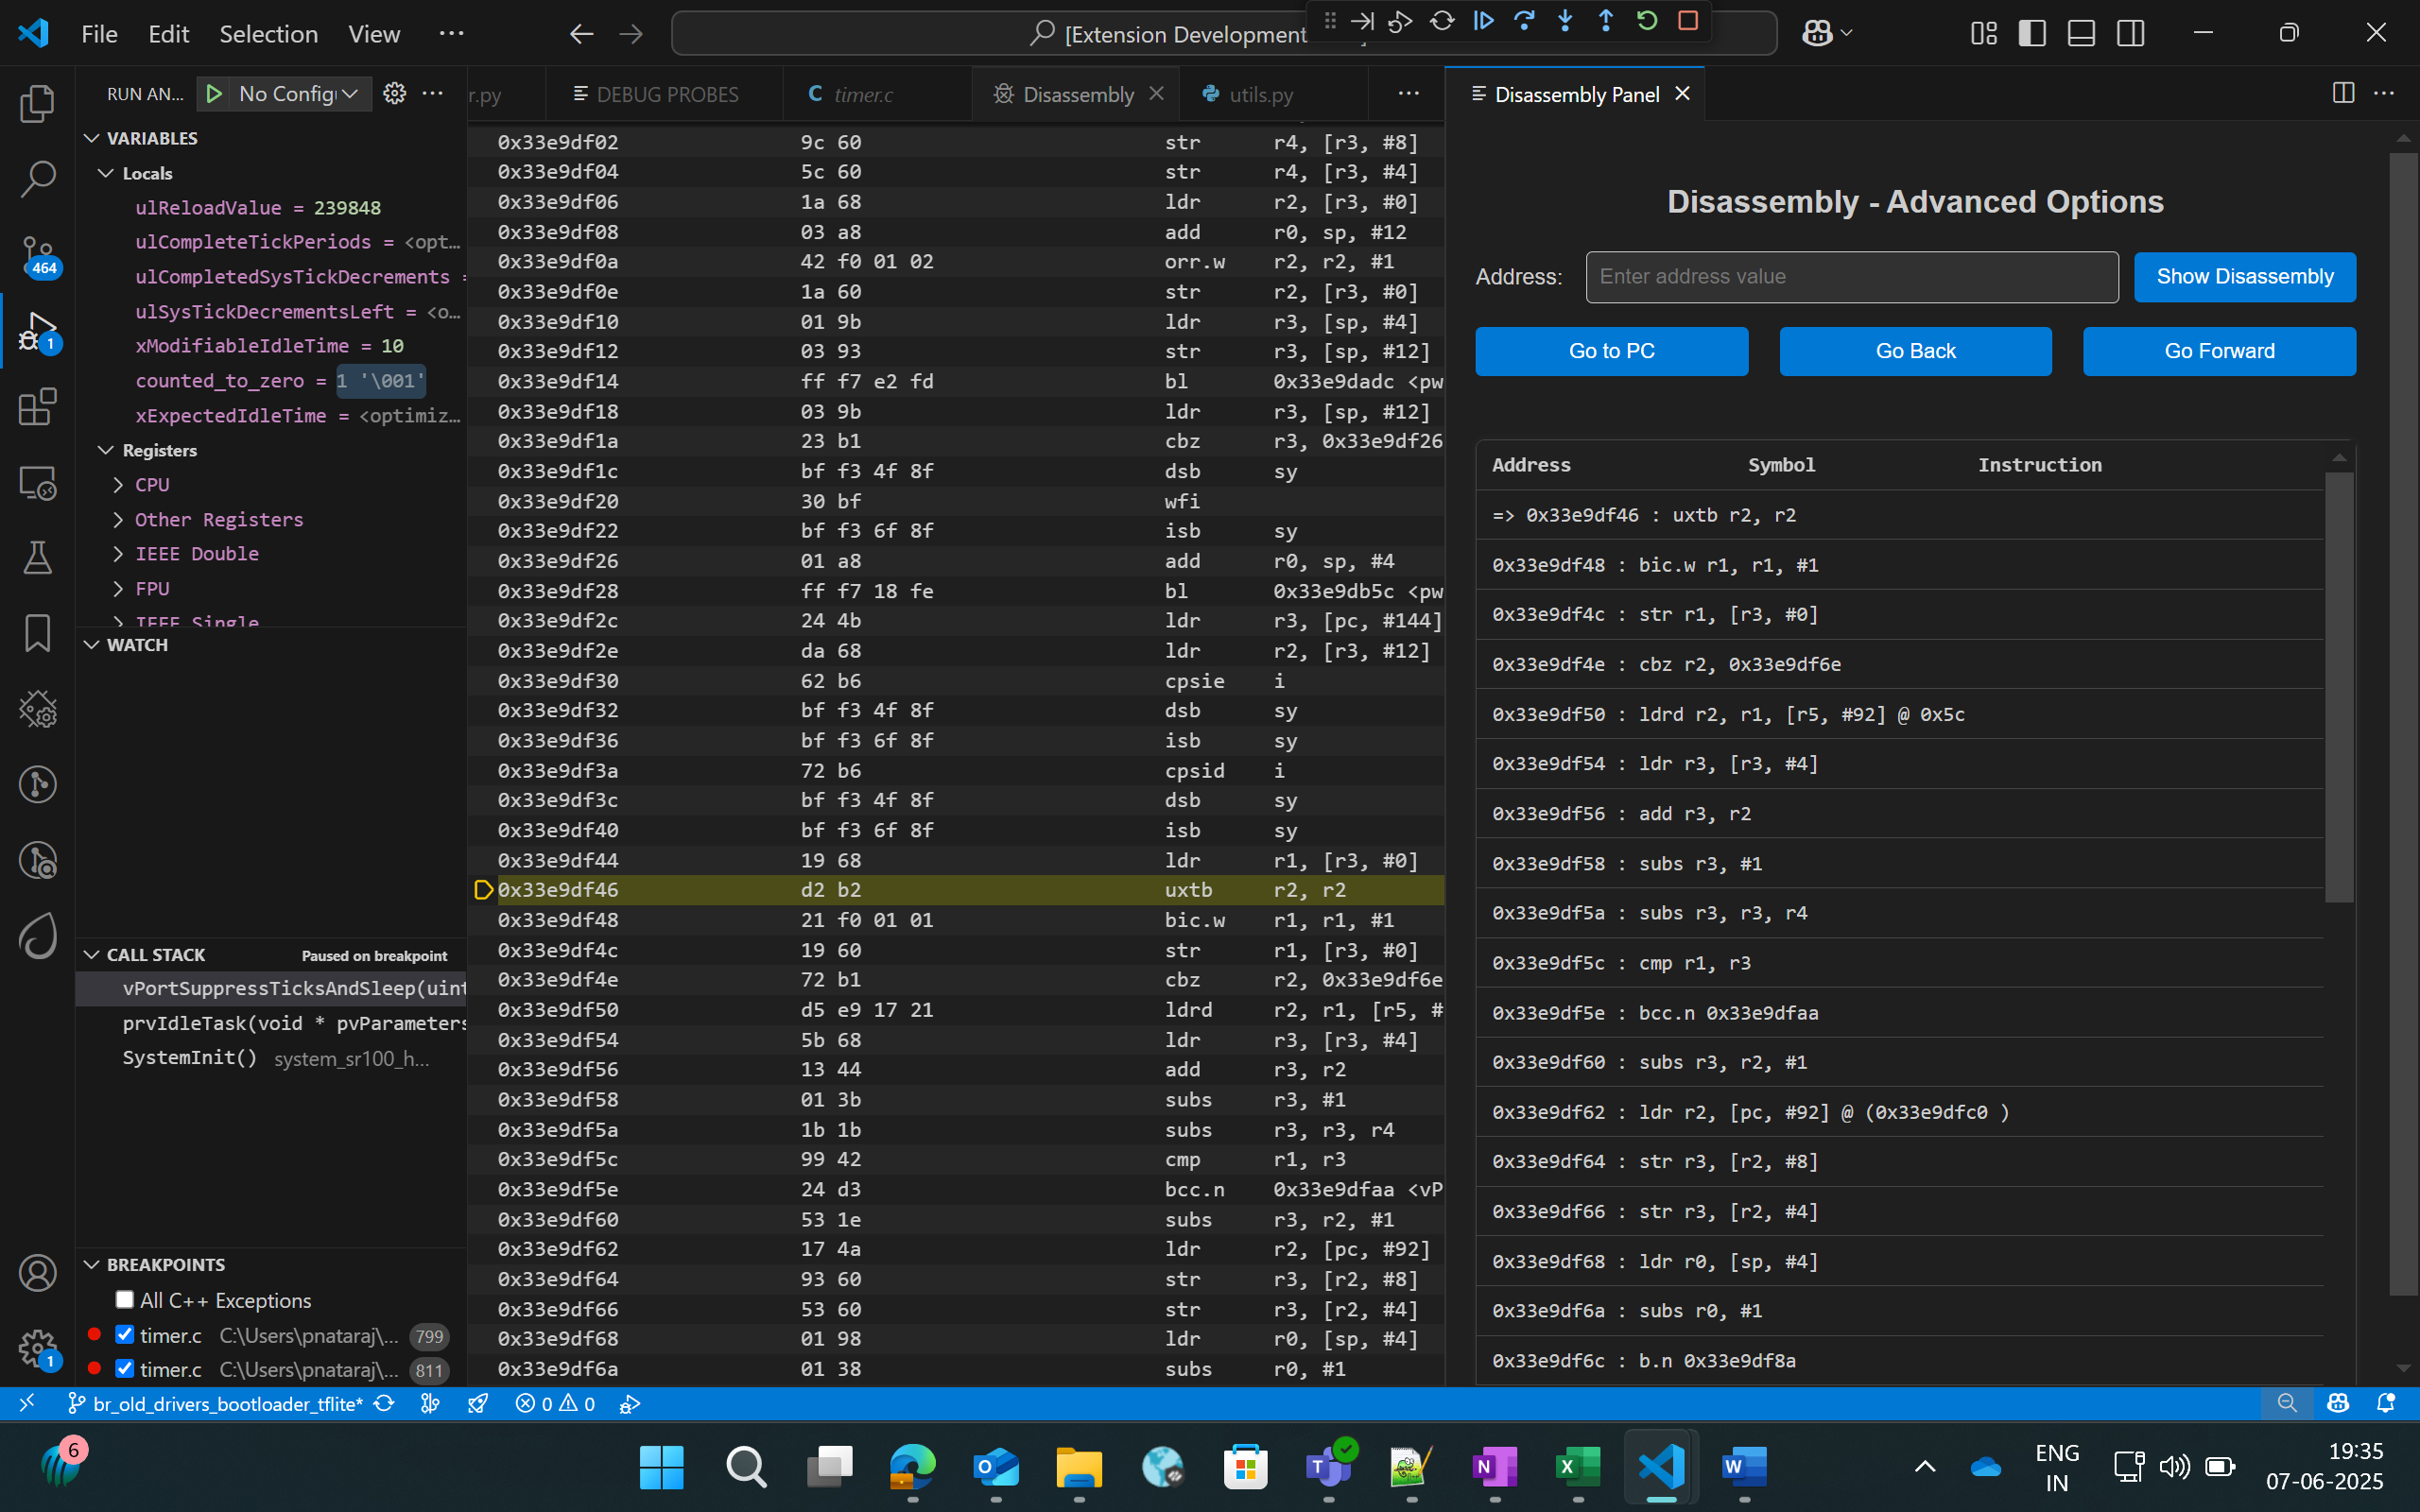
Disassembly Viewer
Purpose: View disassembly with navigation tools.
Right-click in the editor and select Open Advanced Disassembly Viewer.
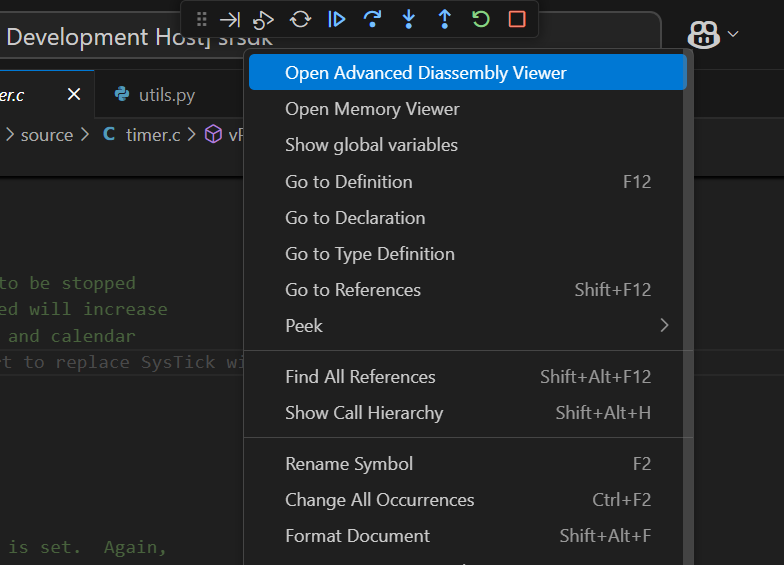
Use the advanced panel to jump to addresses, go to PC, or navigate history.
Logging (while debugging)
To redirect logs to the OpenOCD terminal:
Edit Configs → COMPONENTS CONFIGURATION → Utilities → LOGGER_DEFAULT_INTERFACE.
Select
LOGGER_IF_CONSOLEorLOGGER_IF_UART_1_CONSOLE, save, and rebuild in Debug mode.
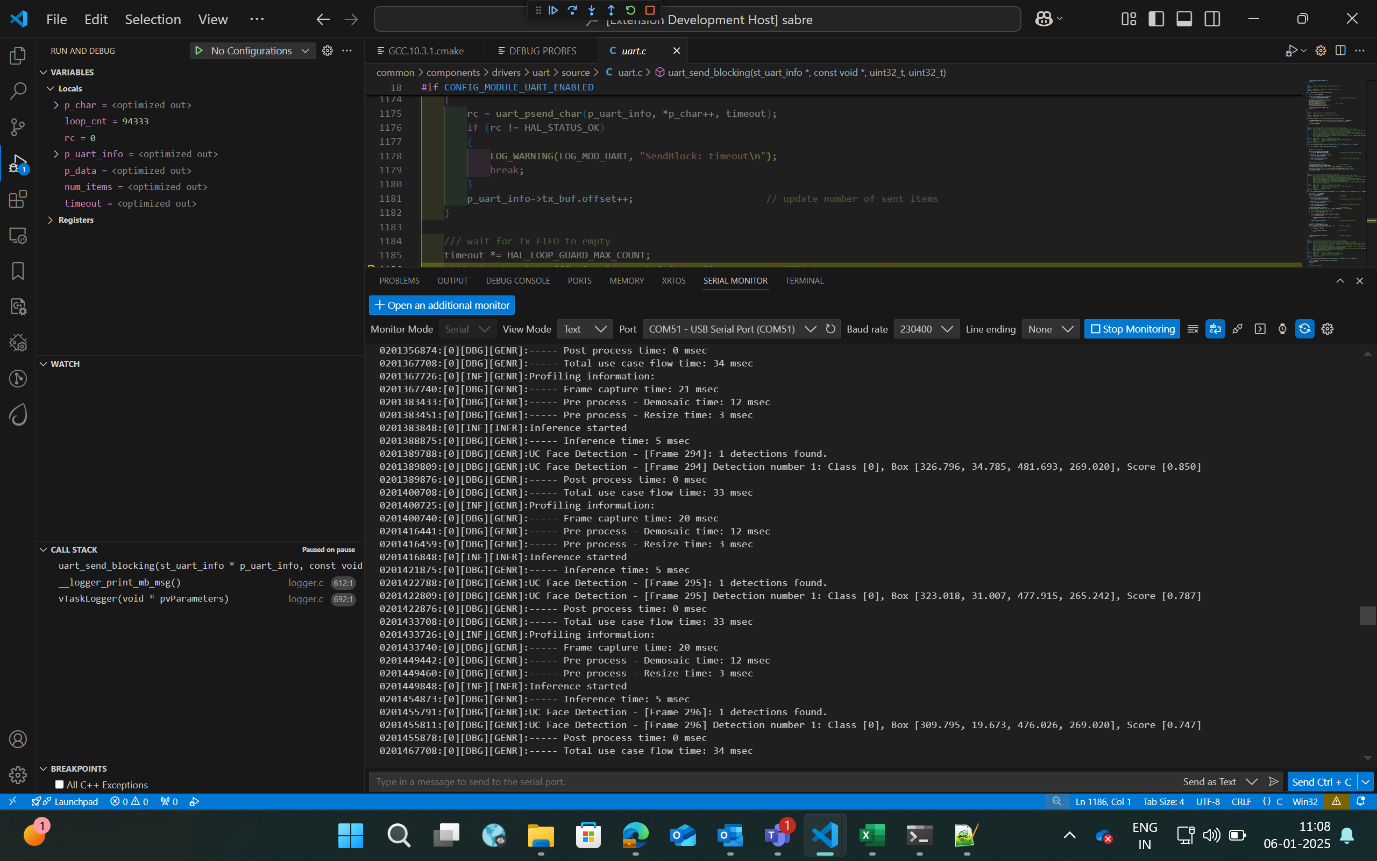
To view logs via DAP logger port:
Ensure Serial Monitor extension is installed.
Start a debug session, select the DAP logger port in Serial Monitor, and click Start Monitoring.
Attach to Running Program
Follow the configuration steps above, then select Attach to Running Program as the debug mode. This attaches to an already running binary and allows pause/inspect.
Attach and Halt Program
Follow the configuration steps above, then select Attach and Halt Program to attach and pause immediately.
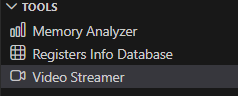
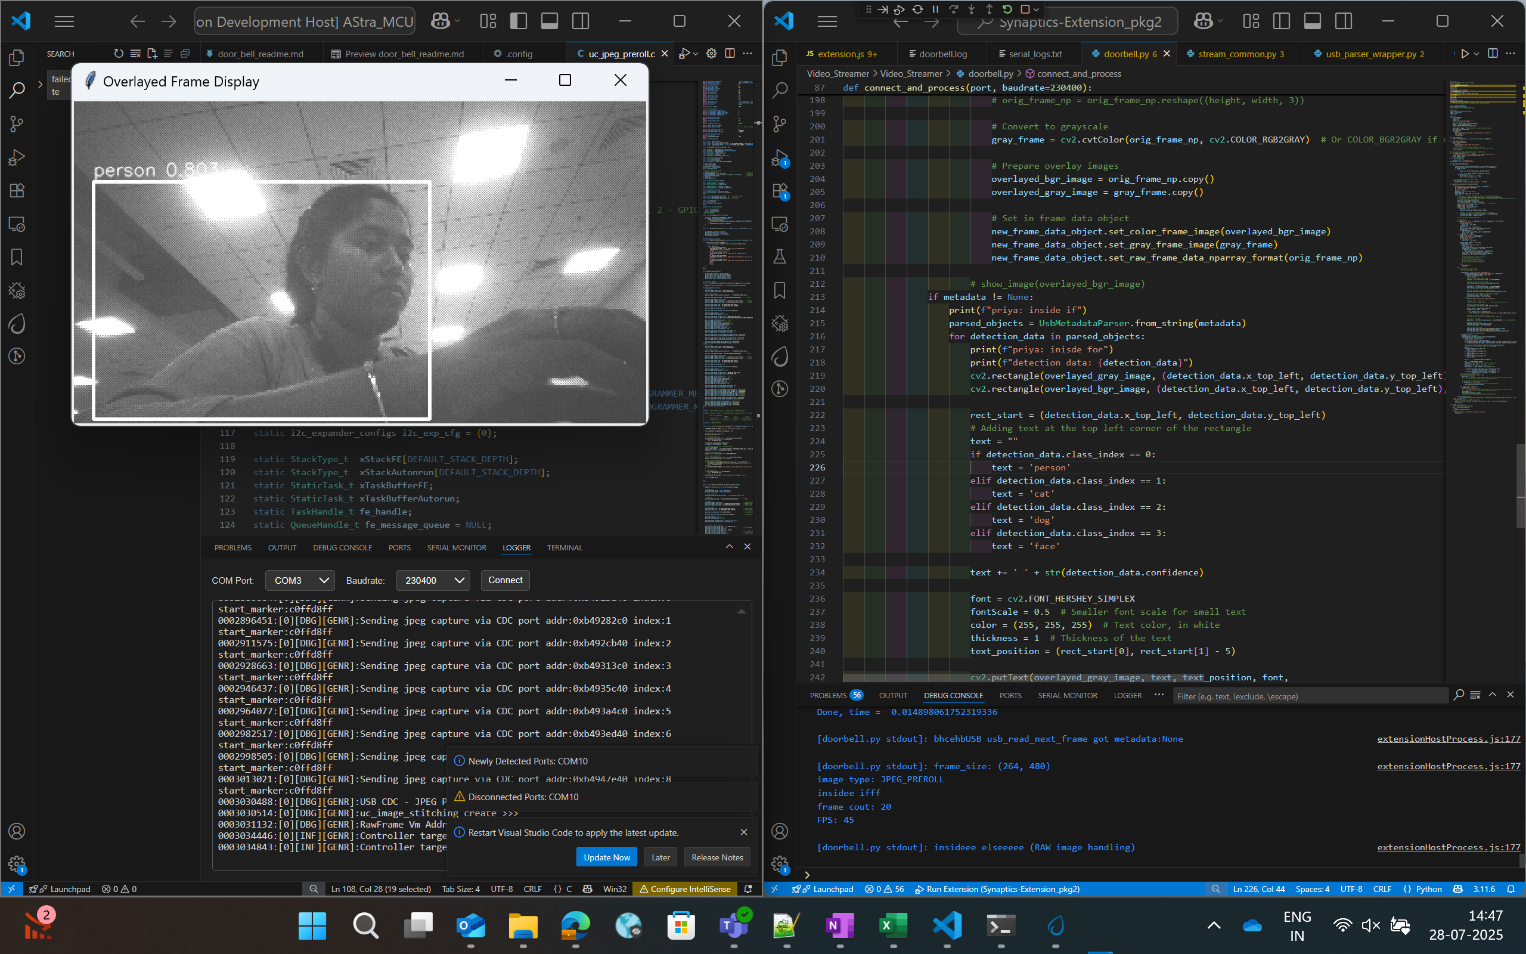
Video Streamer
🔧 SR110 only
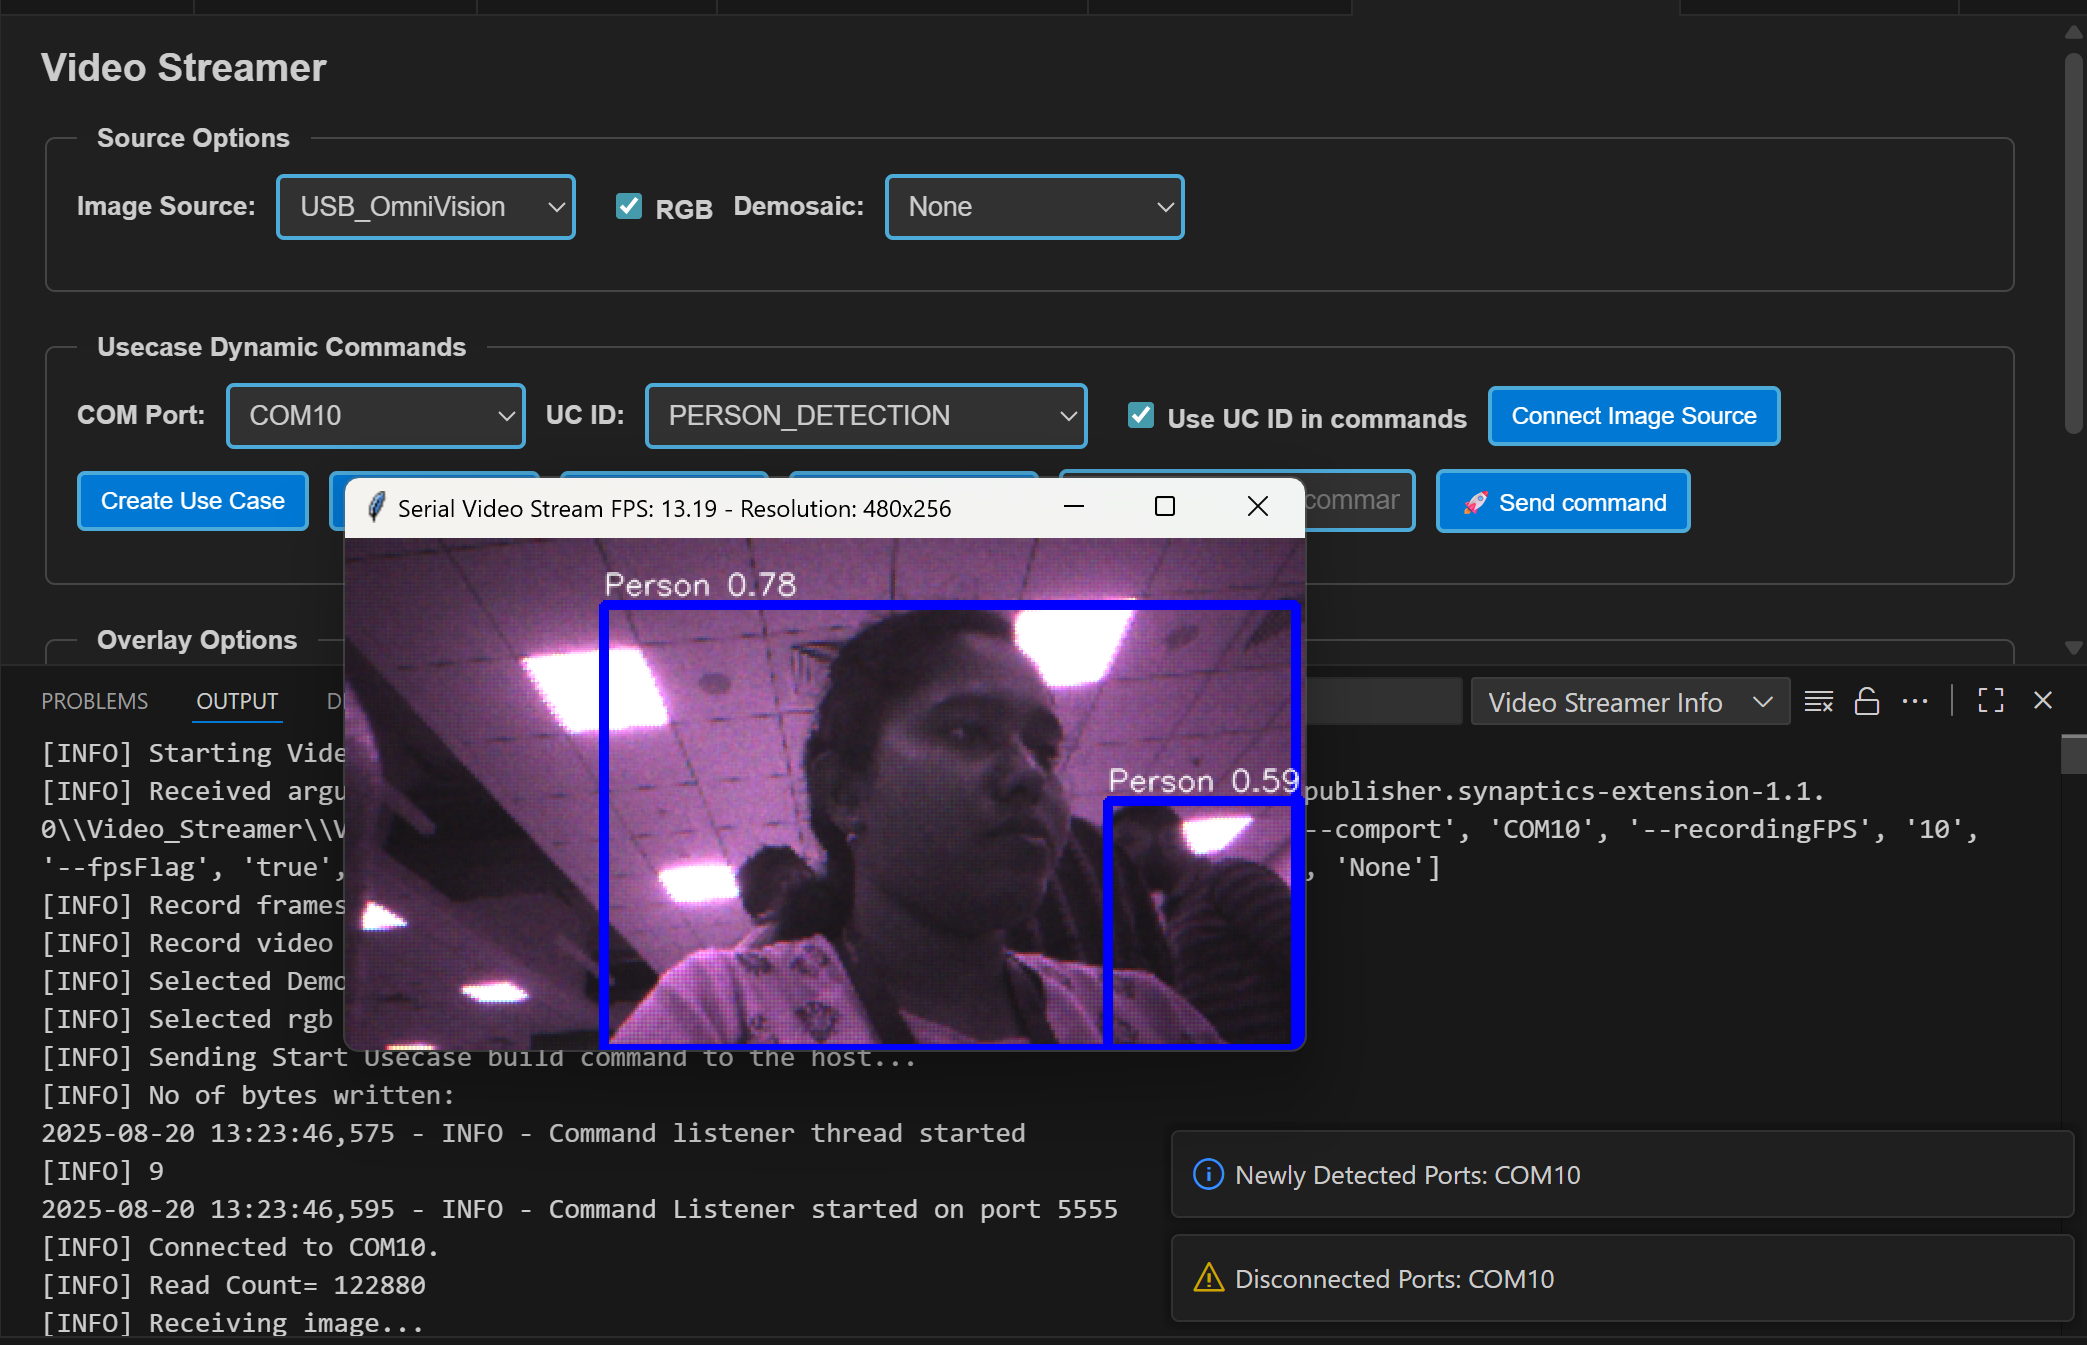
Purpose: Stream video output frames while a vision use case is running.
Pre-requisites:
Install Python and required packages via the Astra SDK Tools Installer.
Flash the vision use case binary and ensure the device is connected.
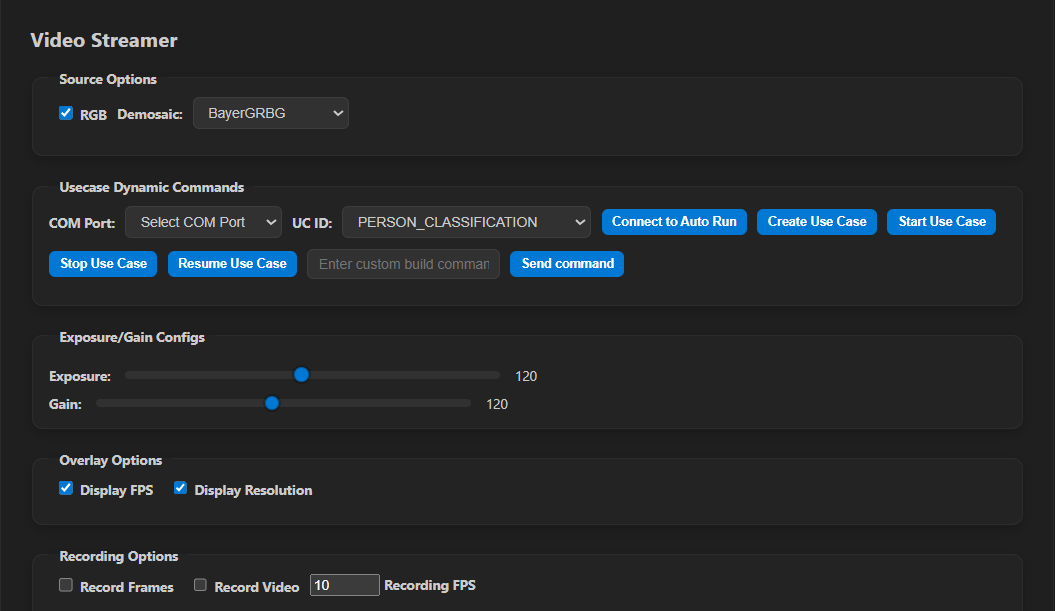
Steps for vision use cases:
Source options:
RGB: display frames in RGB (unchecked = grayscale).
Demosaic: select demosaic type from the dropdown.
Overlay options: Toggle FPS and Resolution overlays.
Recording options:
Record Frames: save raw and overlayed frames.
Record Video: save frames as video.
Recording FPS: control saved video frame rate.
Output location:
Windows:
C:/Users/<username>/video_stream_outputLinux:
/home/<username>/video_stream_outputmacOS:
/Users/<username>/video_stream_output
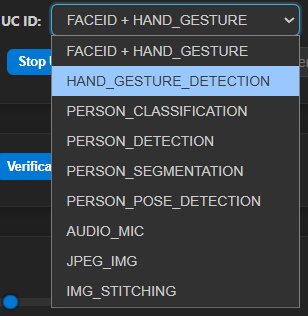
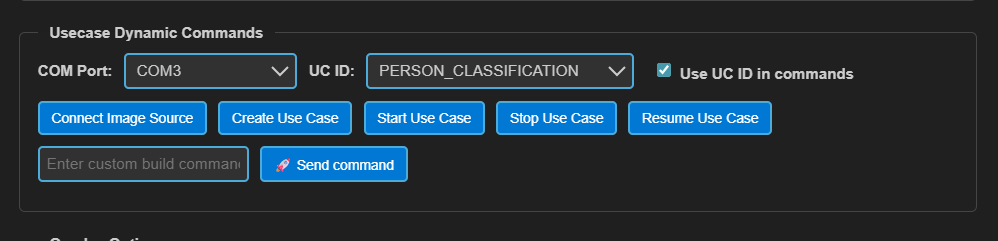
Usecase Dynamic Commands:
Select the CDC port, choose UC ID, and click Create Use Case.
Use Send command for custom commands if needed.
Click Start Use Case to begin streaming (video pops up).
Use Stop Use Case to stop; Resume Use Case to restart.
Recovery if streamer freezes:
Close the video window, click Stop Use Case, press Reset, and try again.
Hand Gesture Detection use case:
Select Hand Gesture Detection in UC ID, then Create Use Case and Start Use Case.
Switch visualization modes (720p, 320x320, Text only).
Adjust exposure/gain sliders as needed.
If upgrading from older extension versions, reinstall Python packages (new modules are used).
Face ID + Hand Gesture Detection use case:
Users can now select the combined Face ID + Hand Gesture use case from the UC ID dropdown. This allows for concurrent detection and visualization of both faces and gestures.
Note: For non-auto-run use cases, Create Use Case + Start Use Case is sufficient. Connect Image Source is for auto-run use cases.
Doorbell use case (auto-run):
Does not require Create or Start Use Case.
Open LOGGER tab, select the logger port, and click Connect.
Press Application chip RESET to start streaming.
Output location:
Windows:
C:/Users/<username>/video_stream_outputLinux:
/home/<username>/video_stream_outputmacOS:
/Users/<username>/video_stream_output
Wakeup triggers:
Timer (CONFIG_WAKEUP_TRIGGER = 1): wakes every 10 seconds.
GPIO (CONFIG_WAKEUP_TRIGGER = 2): connect GND, wait 10 seconds after hibernation, then connect UART0 RX to trigger wake-up.
Auto-run use cases:
Select UC ID and click Connect Image Source.
The video stream appears automatically.
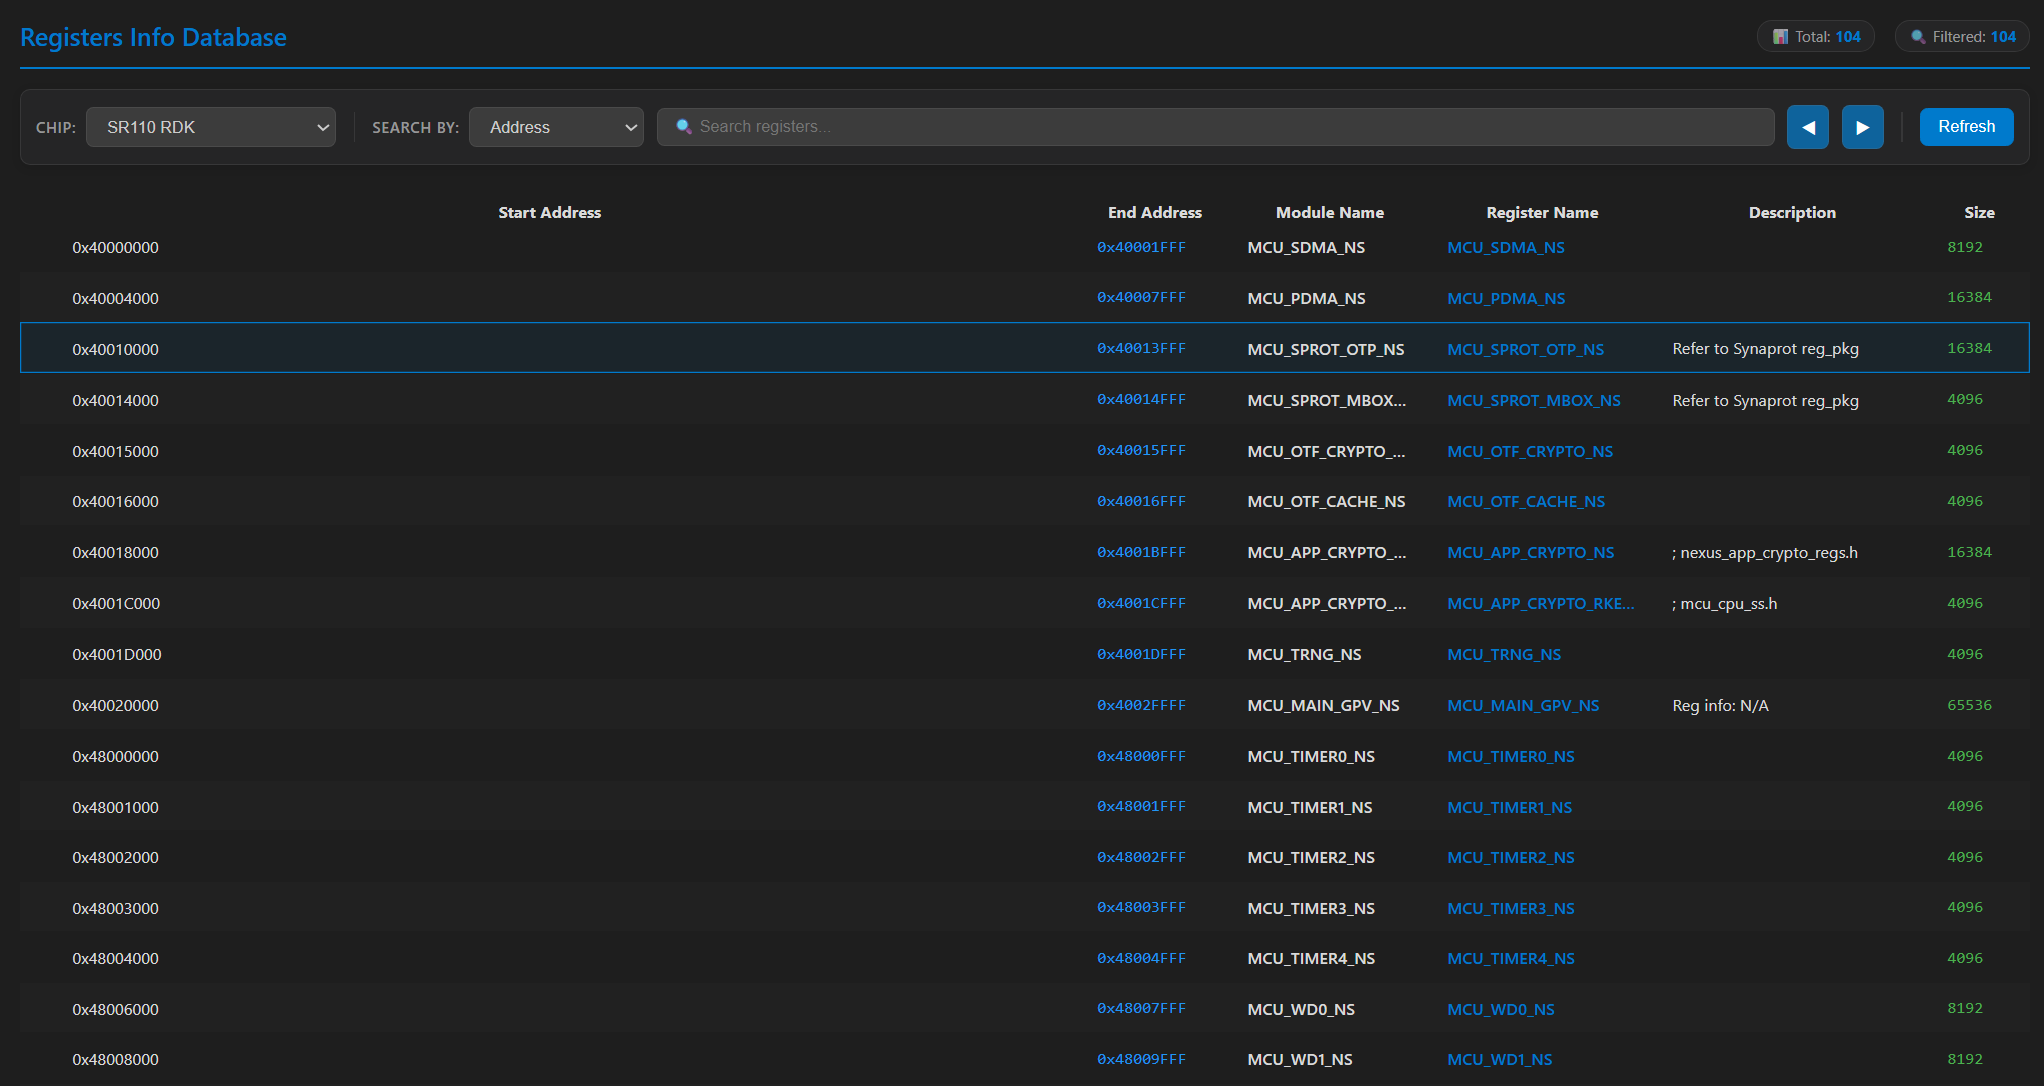
Register Info Data Base
🔧 SR110 only
The Register Info Data Base view provides a searchable database of SoC/peripheral registers, bitfields, and addresses for quick reference.
Steps to use:
Open the Register Info Data Base view from the Synaptics extension sidebar.
Use the search box to find registers by name, address, or description.
What it provides:
Register name, address, size, reset value, description, and bitfield breakdown.
Bitfield details (bit ranges, access type, and notes).
Quick-copy buttons to copy addresses or register names.
Export current search results to CSV.
Tips:
Search by full name (
GPIO_CTRL), partial name (GPIO), address (0x40100000), or description keyword (enable,irq).Use filters to limit results by peripheral, access type (R/W/RW), or address range.